

Question: Represent the annual rainfall data of station A given below as a bar chart with time in chronological order. If the annual rainfall less
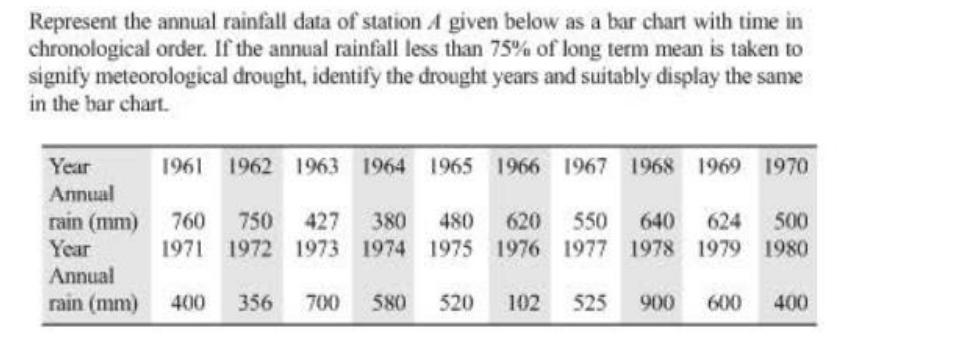
Represent the annual rainfall data of station A given below as a bar chart with time in chronological order. If the annual rainfall less than 75% of long term mean is taken to signify meteorological drought, identify the drought years and suitably display the same in the bar chart. Year Annual rain (mm) 760 750 427 380 480 620 550 640 624 500 Year 1973 1974 1975 1976 1977 1978 1979 1980 1971 1972 Annual rain (mm) 1961 1962 1963 1964 1965 1966 1967 1968 1969 1970 400 356 700 580 520 102 525 900 600 400
Step by Step Solution
3.40 Rating (163 Votes )
There are 3 Steps involved in it
The detailed ... View full answer

Get step-by-step solutions from verified subject matter experts