

Question: Required: 1. Complete the below table to calculate the trend percents for all components of both statements using 2013 as the base year. 2. Refer
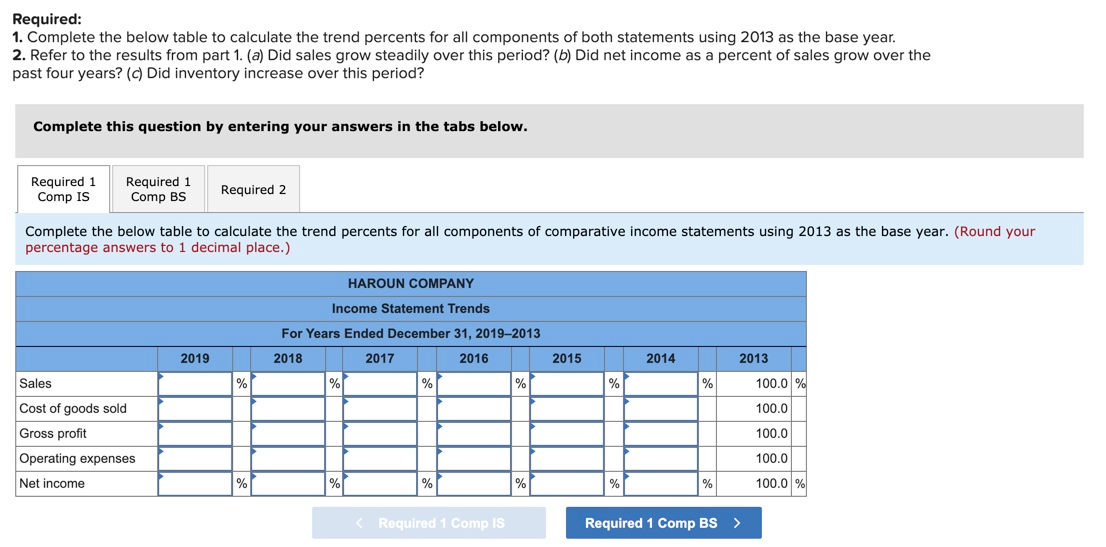
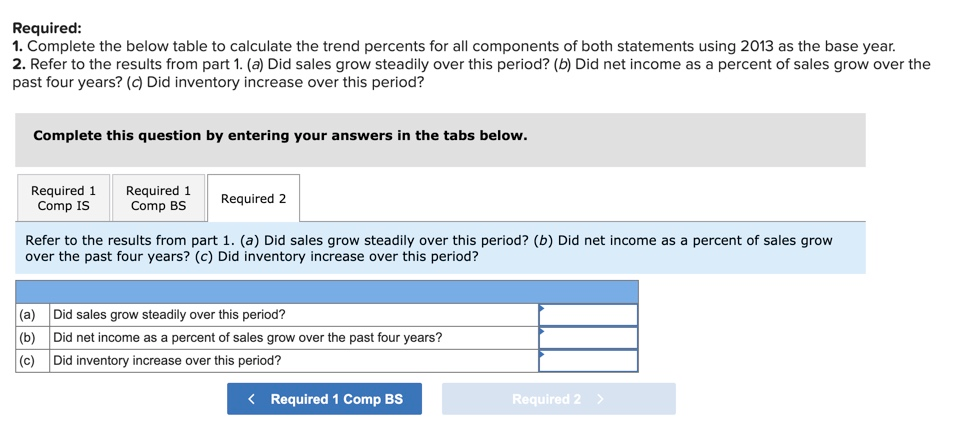
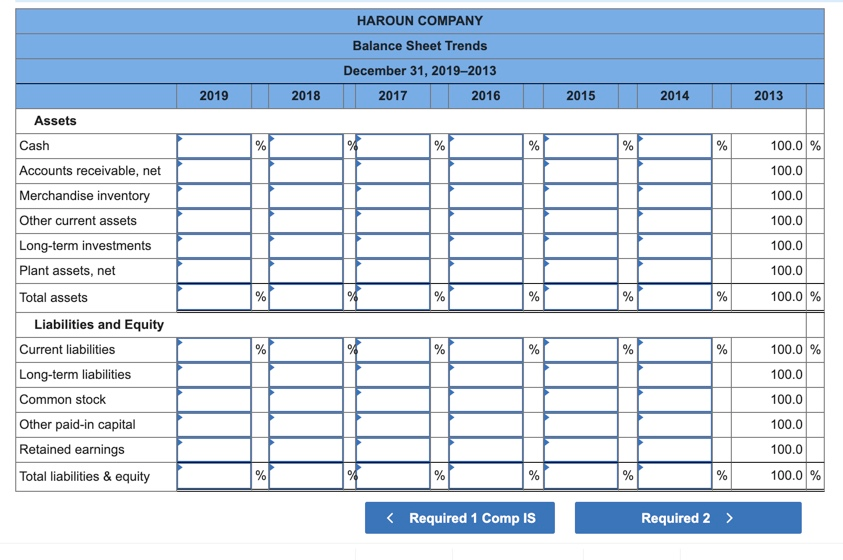
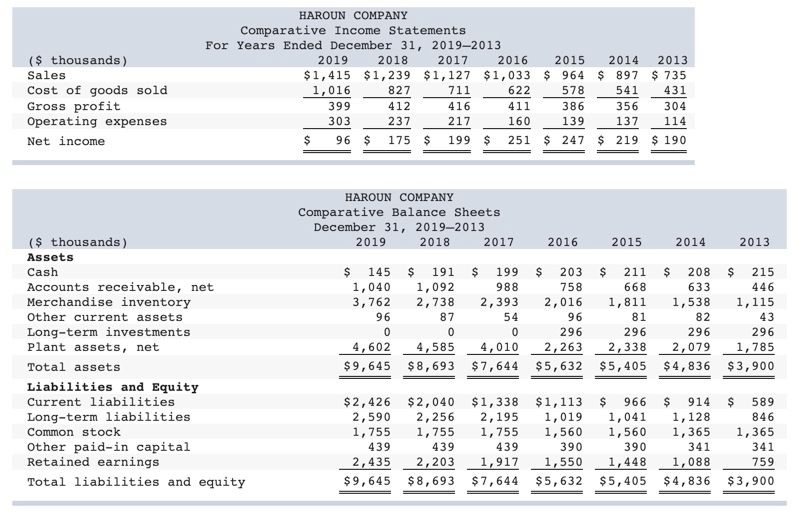
Required: 1. Complete the below table to calculate the trend percents for all components of both statements using 2013 as the base year. 2. Refer to the results from part 1. (a) Did sales grow steadily over this period? (b) Did net income as a percent of sales grow over the past four years? (c) Did inventory increase over this period? Complete this question by entering your answers in the tabs below. Required 1 Comp IS Required 1 Comp BS Required 2 Complete the below table to calculate the trend percents for all components of comparative income statements using 2013 as the base year. (Round your percentage answers to 1 decimal place.) HAROUN COMPANY Income Statement Trends For Years Ended December 31, 2019-2013 2018 2017 2016 % % % 2019 2015 2014 2013 Sales % % 100.0 % Cost of goods sold Gross profit Operating expenses 100.0 100.0 100.0 Net income 100.0 Required: 1. Complete the below table to calculate the trend percents for all components of both statements using 2013 as the base year. 2. Refer to the results from part 1. (a) Did sales grow steadily over this period? (b) Did net income as a percent of sales grow over the past four years? (C) Did inventory increase over this period? Complete this question by entering your answers in the tabs below. Required 1 Required 1 Comp IS Required 2 Comp BS Refer to the results from part 1. (a) Did sales grow steadily over this period? (b) Did net income as a percent of sales grow over the past four years? (c) Did inventory increase over this period? (a) (b) Did sales grow steadily over this period? Did net income as a percent of sales grow over the past four years? Did inventory increase over this period? (c) ($ thousands) Sales Cost of goods sold Gross profit Operating expenses Net income HAROUN COMPANY Comparative Income Statements For Years Ended December 31, 2019-2013 2019 2018 2017 2016 2015 2014 2013 $1,415 $1,239 $1,127 $1,033 $ 964 $ 897 $ 735 1,016 827 711 622 578 541 431 399 412 416 411 386 356 304 303 237 217 160 139 137 114 $ 96 $ 175 $ 199 $ 251 $ 247 $ 219 $ 190 HAROUN COMPANY Comparative Balance Sheets December 31, 2019-2013 2019 2018 2017 2016 2015 2014 2013 ($ thousands) Assets Cash Accounts receivable, net Merchandise inventory Other current assets Long-term investments Plant assets, net Total assets Liabilities and Equity Current liabilities Long-term liabilities Common stock Other paid-in capital Retained earnings Total liabilities and equity $ 145 $ 191 $ 199 $ 203 $ 211 $ 208 1,040 1,092 988 758 668 633 3,762 2,738 2,393 2,016 1,811 1,538 96 87 54 96 81 82 0 0 0 296 296 296 4,602 4,585 4,010 2,263 2,338 2,079 $ 9,645 $8,693 $ 7,644 $5,632 $5,405 $4,836 $ 215 446 1,115 43 296 1,785 $3,900 $ 2,426 $2,040 $1,338 $1,113 2,590 2, 256 2,195 1,019 1,755 1,755 1,755 1,560 439 439 439 390 2,435 2,203 1,917 1,550 $9,645 $8,693 $ 7,644 $5,632 $ 966 1,041 1,560 390 1,448 $5,405 $ 914 1,128 1,365 341 1,088 $ 4,836 $ 589 846 1,365 341 759 $3,900
Step by Step Solution
There are 3 Steps involved in it

Get step-by-step solutions from verified subject matter experts