

Question: n Suppose that an economy produces only food and clothing, and that price and quantity data are given in the table below: Good Food Clothes
 n
n
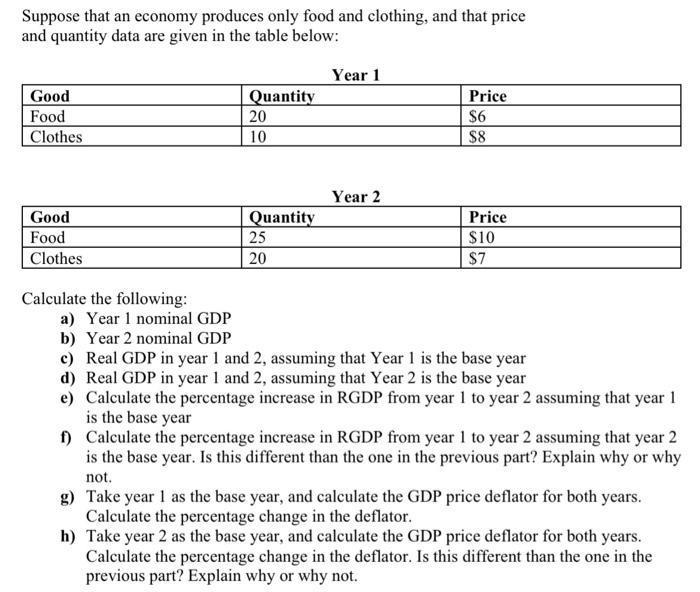
Suppose that an economy produces only food and clothing, and that price and quantity data are given in the table below: Good Food Clothes Good Food Clothes Calculate the following: a) Year 1 nominal GDP Quantity 20 10 Quantity 25 20 Year 1 Year 2 Price $6 $8 Price $10 $7 b) Year 2 nominal GDP c) Real GDP in year 1 and 2, assuming that Year 1 is the base year d) Real GDP in year 1 and 2, assuming that Year 2 is the base year e) Calculate the percentage increase in RGDP from year 1 to year 2 assuming that year 1 is the base year f) Calculate the percentage increase in RGDP from year 1 to year 2 assuming that year 2 is the base year. Is this different than the one in the previous part? Explain why or why not. g) Take year 1 as the base year, and calculate the GDP price deflator for both years. Calculate the percentage change in the deflator. h) Take year 2 as the base year, and calculate the GDP price deflator for both years. Calculate the percentage change in the deflator. Is this different than the one in the previous part? Explain why or why not.
Step by Step Solution
3.44 Rating (151 Votes )
There are 3 Steps involved in it
a Year 1 nominal GDP Nominal GDP Quantity of Food x Price of Food Quantity of Clothes x Price of Clothes Nominal GDP 10 x 6 8 x 8 Nominal GDP 60 64 Nominal GDP 124 b Year 2 nominal GDP Nominal GDP Qua... View full answer

Get step-by-step solutions from verified subject matter experts