

Question: Residual Plots for New Subscriptions Normal Probability Plot Versus Fits 1000- 90 500 Percent 50 Residual 10 -500 1000 -500 0 500 1000 3000 4000

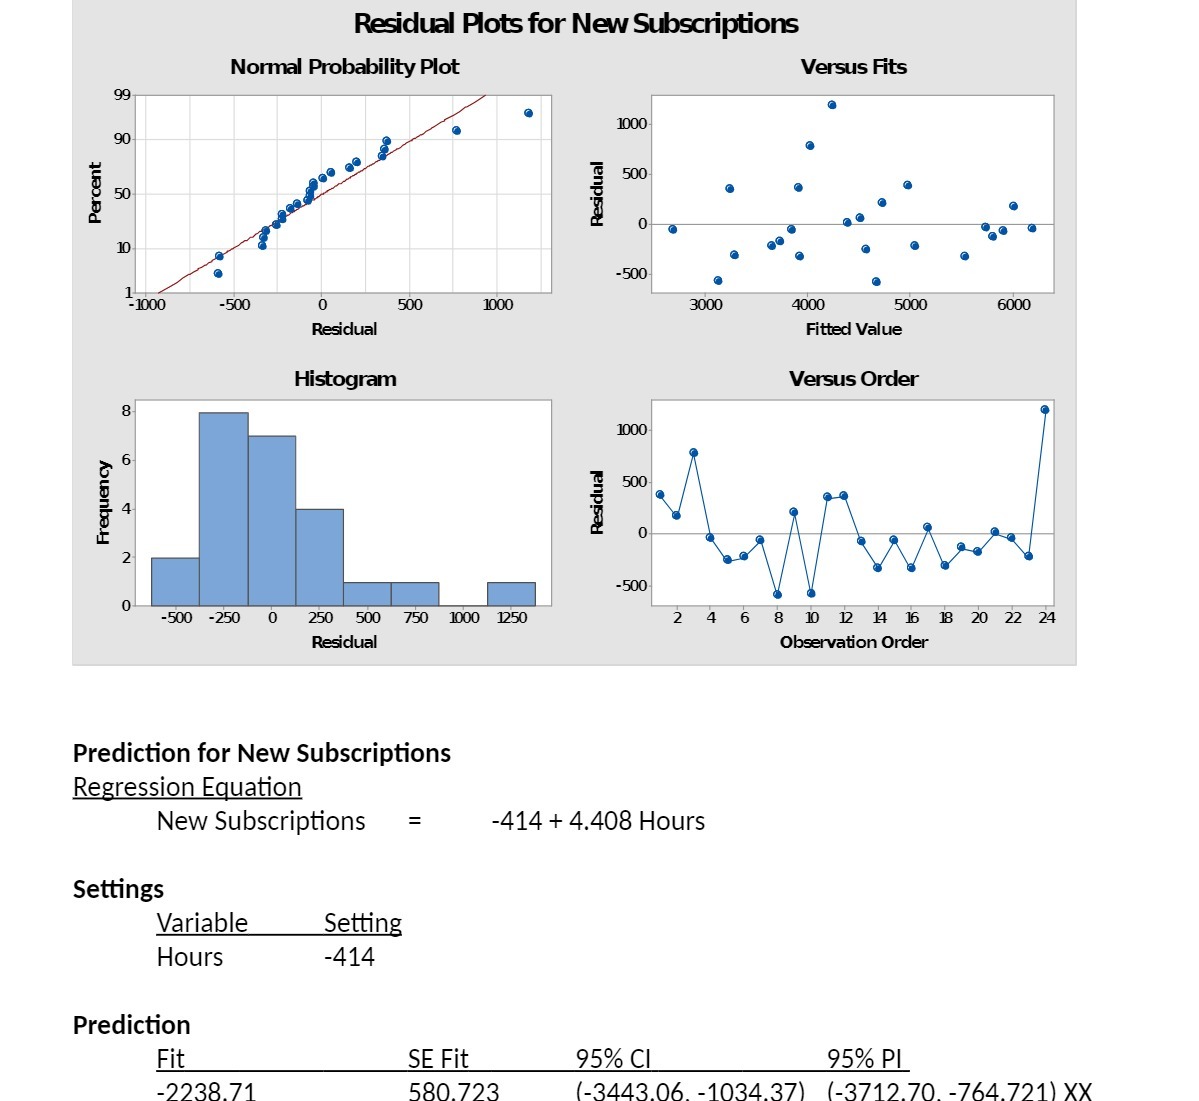
Residual Plots for New Subscriptions Normal Probability Plot Versus Fits 1000- 90 500 Percent 50 Residual 10 -500 1000 -500 0 500 1000 3000 4000 5000 6000 Residual Fitted Value Histogram Versus Order 8 1000 500 Residual Frequency 4 2 .500 -500 -250 0 250 500 750 1000 1250 2 4 6 8 10 12 14 16 18 20 22 24 Residual Observation Order Prediction for New Subscriptions Regression Equation New Subscriptions = -414 + 4.408 Hours Settings Variable Setting Hours -414 Prediction Fit SE Fit 95% CI 95% PL 2238.71 580.723 (-3443.06. -1034.37) (-3712.70. -764.721) XX
Step by Step Solution
There are 3 Steps involved in it
1 Expert Approved Answer
Step: 1 Unlock

Question Has Been Solved by an Expert!
Get step-by-step solutions from verified subject matter experts
Step: 2 Unlock
Step: 3 Unlock