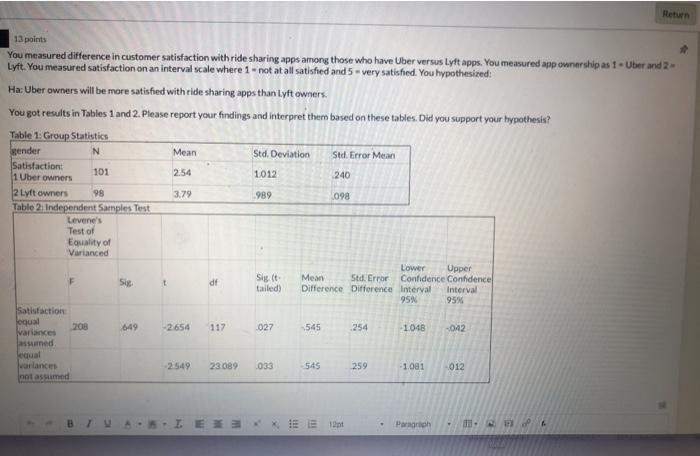
Question: Return 2.54 13 points You measured difference in customer satisfaction with ride sharing apps among those who have Uber versus Lyft apps. You measured app

Return 2.54 13 points You measured difference in
Return 2.54 13 points You measured difference in customer satisfaction with ride sharing apps among those who have Uber versus Lyft apps. You measured app ownership as 1 - Uber and 2 Lyft. You measured satisfaction on an interval scale where 1 - not at all satisfied and 5 - very satisfied. You hypothesised: Ha:Uber owners will be more satisfied with ride sharing apps than lyft owners. You got results in Tables 1 and 2. Please report your findings and interpret them based on these tables. Did you support your hypothesis? Table 1: Group Statistics gender N Mean Std. Deviation Std. Error Mean Satisfaction: 1 Uber owners 101 1012 240 2 Lyft owners 98 3.79 989 098 Table 2 Independent Samples Test Levene's Test of Equality of Varianced Lower Upper Mean Std. Error Sig Confidence Confidence tailed) Difference Difference Interval Interval 95% 95% Satisfaction lequal 208 649 -2654 117 027 545 254 1048 -042 variances assumed equal variances 2549 23.089 033 545 259 -1081 012 not assumed df Sigit - LEXIE ET Paragraph

Step by Step Solution

There are 3 Steps involved in it

1 Expert Approved Answer
Step: 1 Unlock blur-text-image
Question Has Been Solved by an Expert!

Get step-by-step solutions from verified subject matter experts

Step: 2 Unlock
Step: 3 Unlock

Students Have Also Explored These Related General Management Questions!