

Question: Review View Automate Help Arial B AA Percentage Conditional Formatting Insert - 5 - % Pale BI U - E- O- A- E Format as
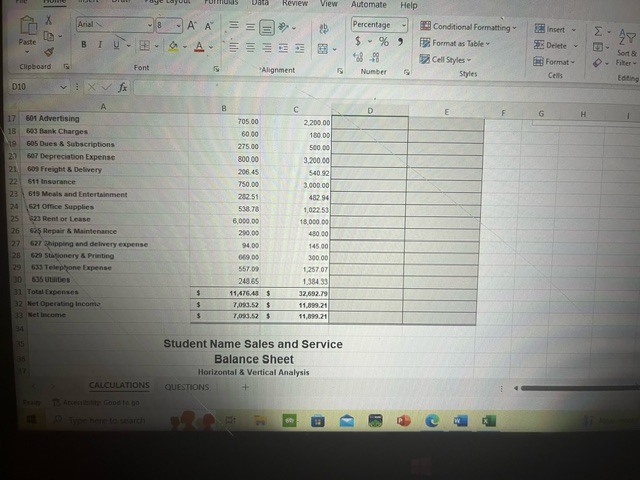
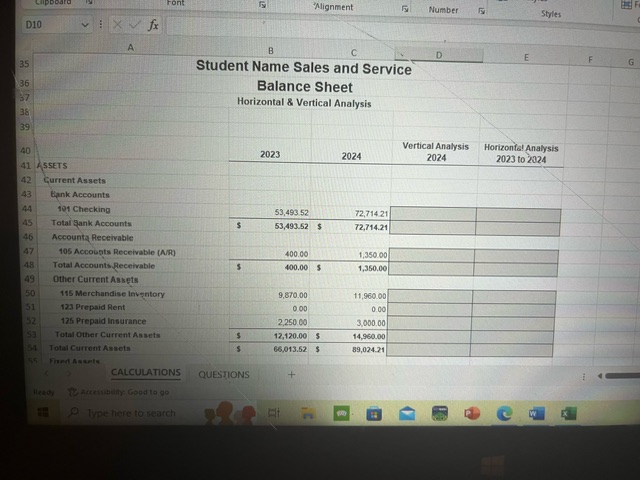
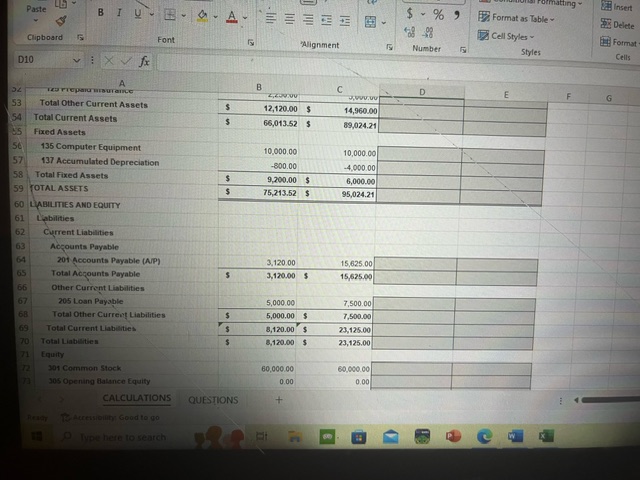
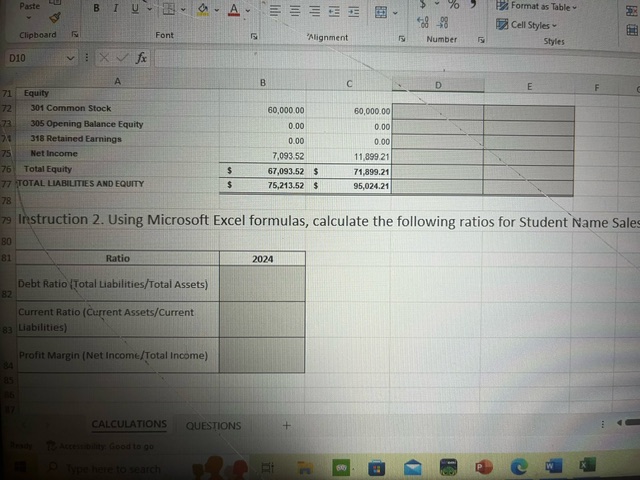
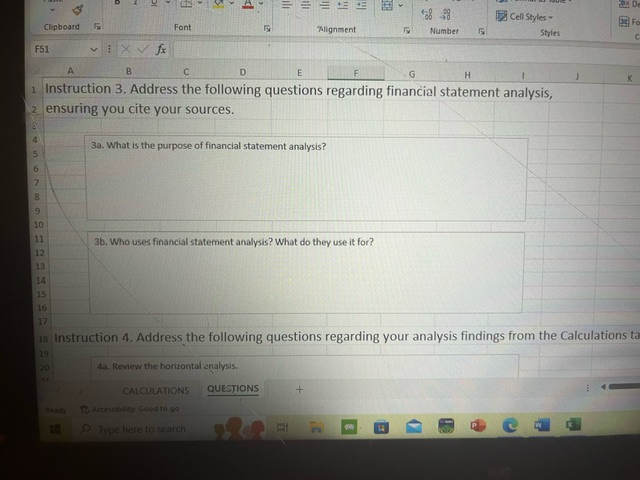
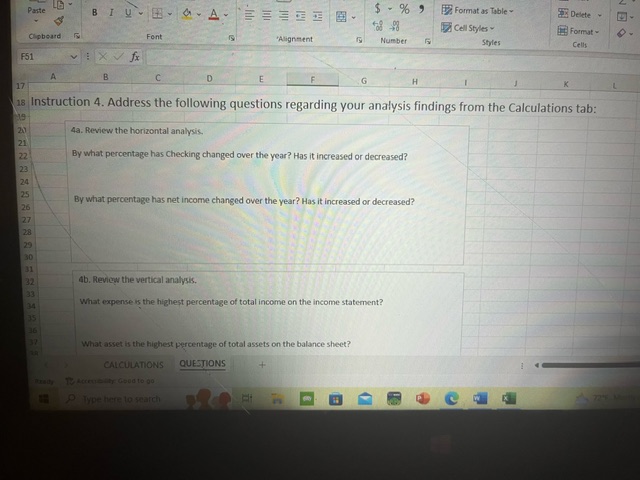
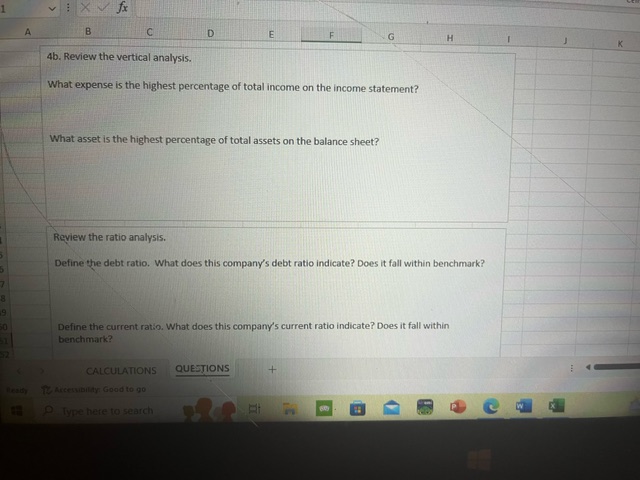
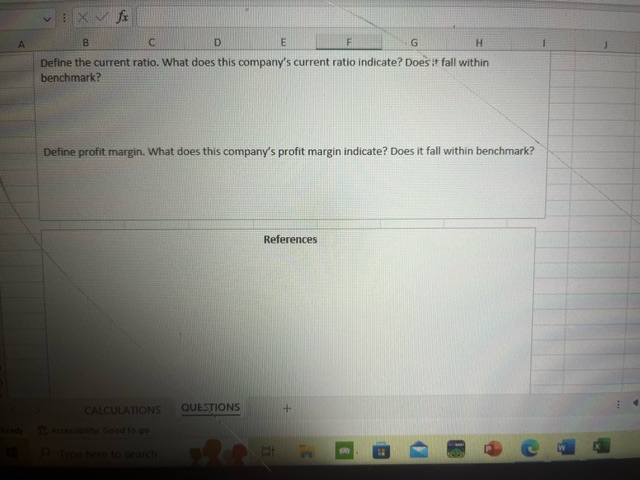
Review View Automate Help Arial B AA Percentage Conditional Formatting Insert - 5 - % Pale BI U - E- O- A- E Format as Table Delete For & Call Styles - Format = Filter = Clipboard Font Alignment Styles Cella D10 A C E F G H 17 601 Advertising 705 00 2.200.0 18 604 Park Charges 60.80 180.08 605 Dues & Subscriptions 275.00 500.00 607 Depreciation Expense 800.00 3,200 60 21 God Freight & Delivery 206:45 540.97 $11 Insurance 750.00 3.000 00 23 619 Meals and Entertainment 282 51 482 94 621 Office Supplies 538.78 1,037 54 523 Rent or Lease 6.090.08 15.080.90 645 Repair & Maintenance 210.03 480.80 637 Chipping and delivery capense 94.0 145.00 420 Stationery & Printing 300 00 (630 Telephone Expense 1,267.07 835 Utiliting 1.384.31 31 Total Expenses 11,47640 $ 32 693.79 32 Net Operating Income 7.053.57 11 093.21 33 Net Income 7.053.42 11,099.21 Student Name Sales and Service Balance Sheet Horizontal & Vertical Analysis CALCULATIONS QUESTIONS To Arceulbilly Good to go Type here to searchLIPDOSTO Font Alignment Number Styles D10 A B C D E F G 35 Student Name Sales and Service Balance Sheet 37 Horizontal & Vertical Analysis 39 Vertical Analysis Horizonte! Analysis 2023 2024 2024 2023 to 2324 41 ASSETS 42 Current Assets 43 Bank Accounts 101 Checking 53,493 52 72,714 21 Total Sank Accounts 53,493.52 $ 72,714.21 Accounts Receivable 47 105 Accounts Receivable [Ant] 400.00 1,350.00 48 Total Accounts Receivable 400.00 1,350.00 49 Other Current Assets 50 116 Merchandise Inventory 8.870.00 11,960.00 51 123 Prepaid Rent 0.00 52 125 Prepaid Insurance 2.250.00 3.000.00 53 Total Other Current Assets $ 12,120.00 $ 14,950.00 54 Total Current Assets 86 013.62 $ 89.034.21 CALCULATIONS QUESTIONS + Ready 13 Accessibility: Good to go O Type here to search n Wmatting ~ Insert Paste B I U - - 4 - A- E % " Format as Table - Delete Clipboard i Cell Styles - Font Alignment Format Number Styles Cells D10 A C D E F G 53 Total Other Current Assets 12,120.00 14,960.00 Total Current Assets 65,013.52 $ 89 024.21 Fixed Assets 50 135 Computer Equipment 10.000,00 10,000.00 57 137 Accumulated Depreciation 800.00 -4.000.00 58 Total Fixed Assets 9.700,00 $ 6,000.00 59 TOTAL ASSETS 75,213.52 $ 95,024.21 60 LIABILITIES AND EQUITY 61 Liabilities 62 Current Liabilities 63 Accounts Payable 164 201 Accounts Payable [AMP) 3.120.00 15,625,00 65 Total Accounts Payable 3,120.00 $ 15.625.90 Other Current Liabilities 67 205 Loan Payable 5,000.00 7,500.00 68 Total Other Current Liabilities $ 5,000.00 $ 7,500.00 69 Total Current Liabilities B.120.00 5 23.125.00 Total Liabilities .120.00 23,125,00 71 Equity 72 301 Common Stock 60,000.00 60 090.00 305 Opening Balance Equity 0.00 0.00 CALCULATIONS QUESTIONS + To Accessibility Good to go Type here to search nPaste B I U - - G - A - EEEEE 70 Format as Table - Cell Styles Clipboard Font Alignment Number Styles DID A B C D E F 71 Equity 72 301 Common Stock 60.000 00 60,000 00 73 305 Opening Balance Equity 0 00 0.00 318 Retained Earnings 0.00 0.00 75 Net Income 7.093.52 11 899.21 76 Total Equity $ 67,093.52 $ 71,899.21 77 TOTAL LIABILITIES AND EQUITY $ 75,213.52 $ 95,024.21 79 Instruction 2. Using Microsoft Excel formulas, calculate the following ratios for Student Name Sales 81 Ratio 2024 Debt Ratio (Total Liabilities/Total Assets) 82 Current Ratio (Current Assets/Current 83 Liabilities) Profit Margin ( Net Income/Total Income) 84 85 CALCULATIONS QUESTIONS FEI + Ready 72 Accessibility Good to go P Type here to search P C WCell Styles Chipboard Font Alignment Number Styles F51 VIXVE A B C D E F G H 1 Instruction 3. Address the following questions regarding financial statement analysis, 2 ensuring you cite your sources. 3a. What is the purpose of financial statement analysis? 3b. Who uses financial statement analysis? What do they use it for? 12 13 14 15 16 17 18 Instruction 4. Address the following questions regarding your analysis findings from the Calculations to 19 Ma. Review the horizontal analysis. CALCULATIONS QUESTIONS + Ready 12 Accept Any Good to go Type here to search PPadle BI U - H- -A- $ - % " Format as Table Delete - Cell Styles . Formut = Cupboard Font Alignment Number Styles Callt F51 viXVf A B C D E F G H 17 is Instruction 4. Address the following questions regarding your analysis findings from the Calculations tab: 19 4a. Review the horizontal analysis. 21 22 By what percentage has Checking changed over the year? Has it increased or decreased? 24 125 By what percentage has net income changed over the year? Has it increased or decreased? 26 29 31 32 ab. Review the vertical analysis. 34 What expense is the highest percentage of total income on the income statement? 35 What asset is the highest percentage of total assets on the balance sheet? CALCULATIONS QUESTIONS P Type here to searchA B C D E F G H K 4b. Review the vertical analysis. What expense is the highest percentage of total income on the income statement? What asset is the highest percentage of total assets on the balance sheet? Review the ratio analysis. Define the debt ratio. What does this company's debt ratio indicate? Does it fall within benchmark? Define the current ratio. What does this company's current ratio indicate? Does it fall within benchmark? CALCULATIONS QUESTIONS + Realy 12 Accessibility: Good to go P Type here to search mA B C D E G H Define the current ratio. What does this company's current ratio indicate? Does it fall within benchmark? Define profit margin. What does this company's profit margin indicate? Does it fall within benchmark? References CALCULATIONS QUESTIONS Accessibility: Good to go O Type here to search WFormat as Table - Sort Er Find & Smainity CallStyle- Format . Fite Select - Clipboard For Number citing A H Instruction 1. Using Microsoft Excel formulas, calculate a horizontal and vertical analysis for Student Name Sales and Service operations for the Profit and Loss and Balance Sheet. Student Name Sales and Service Vertical Analysis comriders all iterm as a percent of Profit and Loss Total Income. The formula is: Statement Hem/Total Horizontal & Vertical Analysis Income, A few have been done for you If you click on the cell you can see the formula, To get out of that Vertical Analysis Hartrental Analyses view, click the Enter or Return button NOTE: THE 2023 2074 2024 2023 10 2024 ONLY COLUMN USED for this analyphi is the October 9 Iconic December column. 10 401 Sign 31,140 00 31 1:43104 1 Horizontal Analyus measures the change in an 17 Control Goods Bold account balance from one point in time to another, In this instance, we are measuring the change from 2031 13 1 Costof Gouda Bold to 2034, The formula is (Current Value - Base 14 Total Costof Goods Fold Value /Bine Vilue, or (2034 amount - 1023 15 Gross Prom 18,410 00 amount /2013 amount. Again, a few have been done for you Watch your formulas on thatone if you don't 17 401 Advertising Mi Back Charges 3.500 DO CALCULATIONS QUESTIONS Type here to search
Step by Step Solution
There are 3 Steps involved in it

Get step-by-step solutions from verified subject matter experts