

Question: Rewrite the following MATLAB script provided to calculate and plot the knee joint angle for a complete gait cycle (heel strike to heel strike). In
Rewrite the following MATLAB script provided to calculate and plot the knee joint angle for a complete gait cycle (heel strike to heel strike). In order to accomplish this, create a MATLAB function to read the .csv file and pass the contents obtained in a "structure" to the main script. You must eliminate the "for loop" with an appropriate "operator". Then, calculate the joint angle from the segment angles and plot over the appropriate scale. The .csv file is also given below.
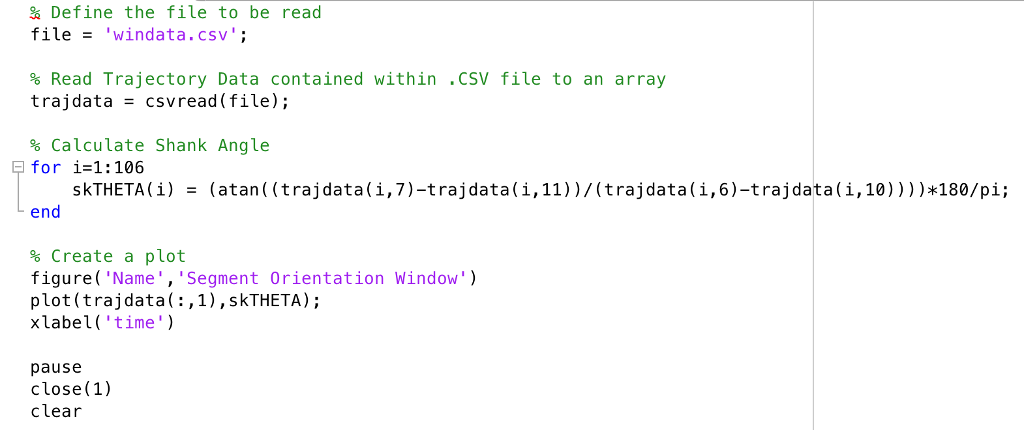
Figure 1 (above): GaitCycleAnalysis Script
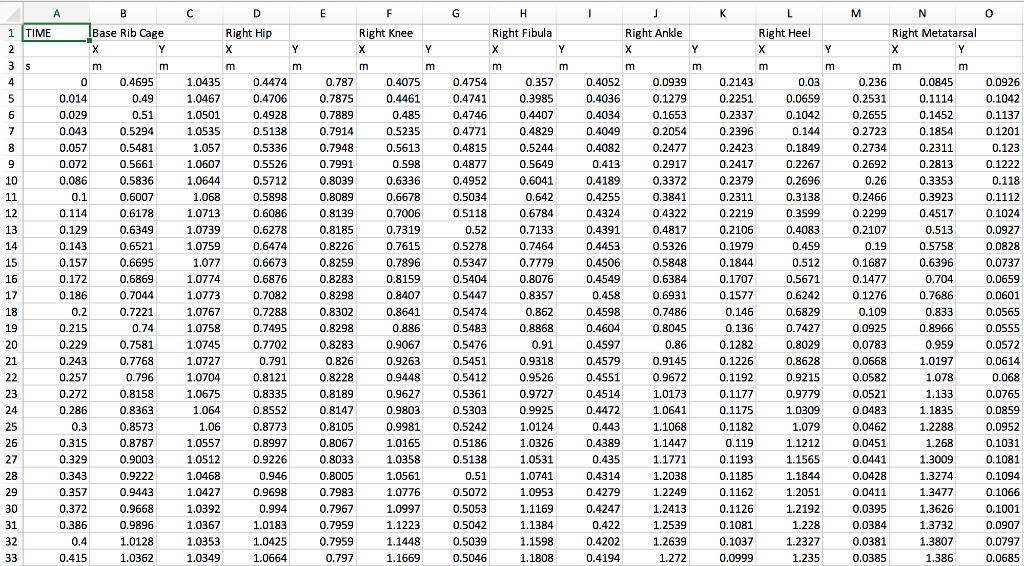
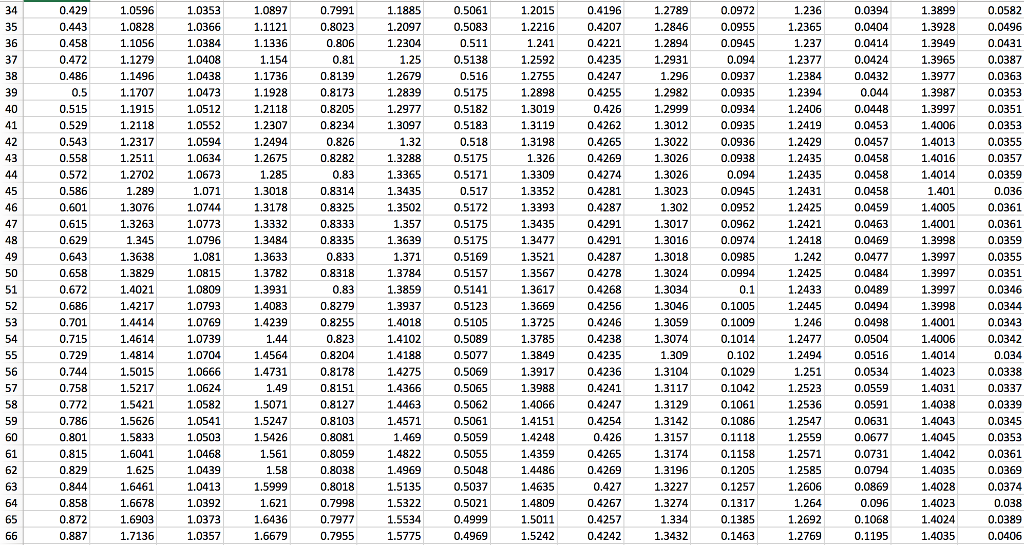
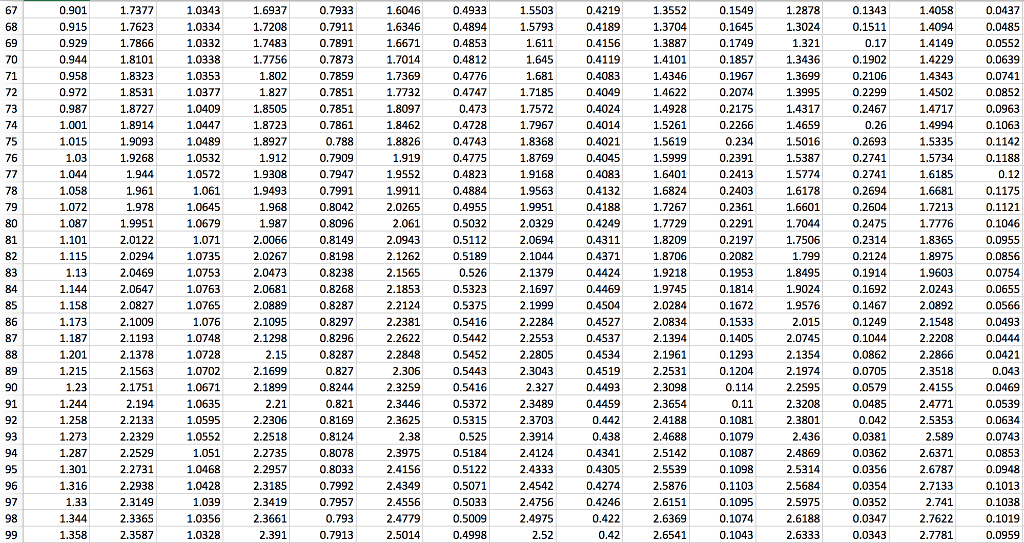
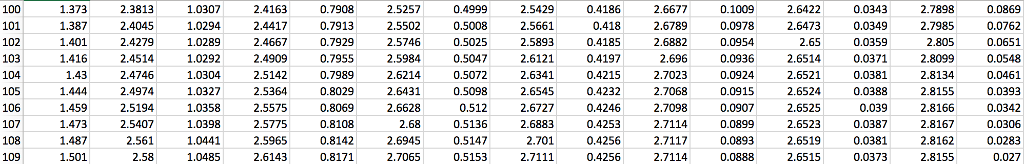
Figure 2 (above): Complete windata.csv data
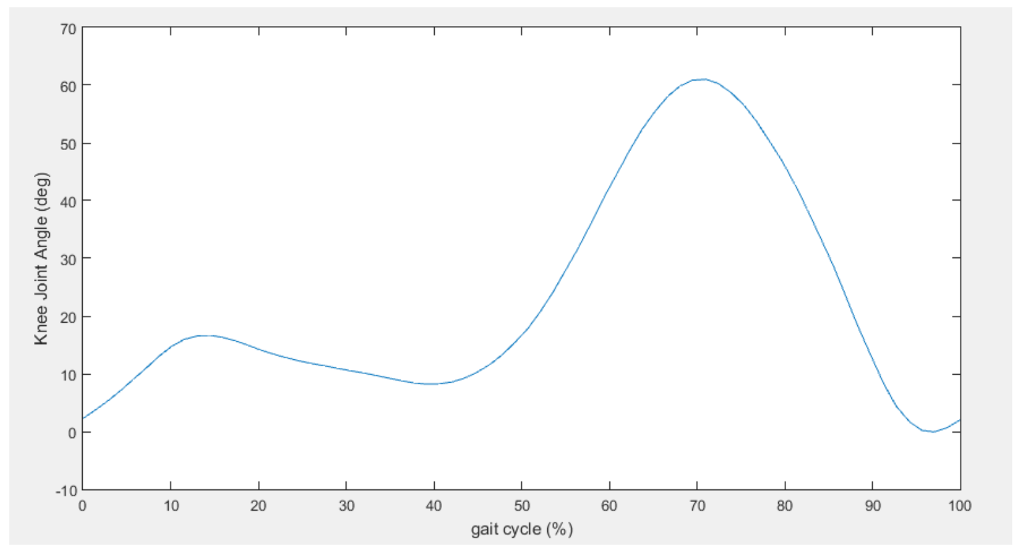
Figure 3 (above): A Plot of what the script should produce
To calculate the angle, use the equation (transcribed in the script) as:
skTHETA = (atan((trajdata(:,7)-trajdata(:,11))./(trajdata(:,6)-trajdata(:,10))))*180/pi; skTHETA(skTHETA
CSV FILE: https://www.dropbox.com/s/tok2a3c6mvv9mry/windata.csv?dl=0
Define the file to be read file'windata.csv' % Read Trajectory Data contained within "CSV file to an array trajdata -csvread(file); % Calculate Shank Angle for i-1: 106 skTHETA ( ) (atan((traj data(,7)-traj data(i,11) ) / ( traj data(i,6)-traj data(i,10))))*180/pi; end % Create a plot figure( 'Name, 'Segment Orientation Window') plot (trajdata(:,1), skTHETA); xlabel ('time' pause close(1) clear Define the file to be read file'windata.csv' % Read Trajectory Data contained within "CSV file to an array trajdata -csvread(file); % Calculate Shank Angle for i-1: 106 skTHETA ( ) (atan((traj data(,7)-traj data(i,11) ) / ( traj data(i,6)-traj data(i,10))))*180/pi; end % Create a plot figure( 'Name, 'Segment Orientation Window') plot (trajdata(:,1), skTHETA); xlabel ('time' pause close(1) clear
Step by Step Solution
There are 3 Steps involved in it

Get step-by-step solutions from verified subject matter experts