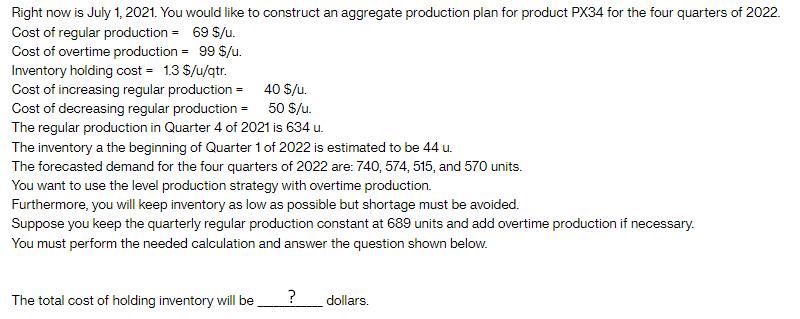
Right now is July 1, 2021. You would like to construct an aggregate production plan for...
Fantastic news! We've Found the answer you've been seeking!
Question:
Transcribed Image Text:
Right now is July 1, 2021. You would like to construct an aggregate production plan for product PX34 for the four quarters of 2022. Cost of regular production = 69 $/u. Cost of overtime production = 99 $/u. Inventory holding cost = 1.3 $/u/qtr. Cost of increasing regular production = Cost of decreasing regular production = 40 $/u. 50 $/u. The regular production in Quarter 4 of 2021 is 634 u. The inventory a the beginning of Quarter 1 of 2022 is estimated to be 44 u. The forecasted demand for the four quarters of 2022 are: 740, 574, 515, and 570 units. You want to use the level production strategy with overtime production. Furthermore, you will keep inventory as low as possible but shortage must be avoided. Suppose you keep the quarterly regular production constant at 689 units and add overtime production if necessary. You must perform the needed calculation and answer the question shown below. The total cost of holding inventory will be ? dollars. Right now is July 1, 2021. You would like to construct an aggregate production plan for product PX34 for the four quarters of 2022. Cost of regular production = 69 $/u. Cost of overtime production = 99 $/u. Inventory holding cost = 1.3 $/u/qtr. Cost of increasing regular production = Cost of decreasing regular production = 40 $/u. 50 $/u. The regular production in Quarter 4 of 2021 is 634 u. The inventory a the beginning of Quarter 1 of 2022 is estimated to be 44 u. The forecasted demand for the four quarters of 2022 are: 740, 574, 515, and 570 units. You want to use the level production strategy with overtime production. Furthermore, you will keep inventory as low as possible but shortage must be avoided. Suppose you keep the quarterly regular production constant at 689 units and add overtime production if necessary. You must perform the needed calculation and answer the question shown below. The total cost of holding inventory will be ? dollars.
Expert Answer:
Answer rating: 100% (QA)
To calculate the total cost of holding inventory we need to consider the inventory levels at the beg... View the full answer
Related Book For
Operations Management
ISBN: 9781259270154
6th Canadian Edition
Authors: William J Stevenson, Mehran Hojati, James Cao
Posted Date:
Students also viewed these general management questions
-
A passive long only Equity portfolio Manager with asset under management (AUM) of $ 1.5 Billion has the following investments: Index Dow Jones S&P 500 FTSE 250 TSX 100 DAX performance CAC 40 SENSEX...
-
KYC's stock price can go up by 15 percent every year, or down by 10 percent. Both outcomes are equally likely. The risk free rate is 5 percent, and the current stock price of KYC is 100. (a) Price a...
-
The Chewy Candy Company would like to determine an aggregate production plan for the next six months. The company makes many different types of candy but feels it can plan its total production in...
-
On April 29, 2016, Auk Corporation acquires 100% of the outstanding stock of Amazon Corporation (E & P of $750,000) for $1.2 million. Amazon Corporation has assets with a fair market value of $1.4...
-
Consider an LTI system with |H(e j? )| = 1, and let arg[H(e j? )] be as shown in Figure. If the input is x[n] = cos (3?/2 n + ?/4), determine the output y[n]. arg[H(e ] 5T/6 m/2 Slope = - 1/3 Slope -...
-
Currently, the unit selling price of a product is $1,500, the unit variable cost is $1,200, and the total fixed costs are $4,500,000. A proposal is being evaluated to increase the unit selling price...
-
Classify the air compressor. Differentiate between reciprocating compressor and rotary compressor.
-
Peak Entertainment acquires 60 percent of its subsidiary Saddlestone Inc. on January 1,2013. In preparing to consolidate Peak and Saddlestone at December 31,2013, we assemble the following...
-
Program for Read name, address, email and phone number of a person through keyboard and print the details.
-
The diagram below represents a process where two components are made at stations A1 and A2 (one component is made at A1 and the other at A2). These components are then assembled at station B and...
-
Based on the EViews result in Table 1, answer the following questions. < Table 1: Estimated Regression Result Dependent Variable: LGDP Method: Least Squares Sample: 2000Q1 201204 Included...
-
How is homeland security budget established and justified and include priorities when it comes to budgeting. provide in text citations
-
What are the criticisms of using high discount rates for the Venture Capital method? How do venture capitalists justify their use?
-
This week focused on the long - term decision - making process and capital budgeting. Take a moment to reflect on one of the following times and share it on the discussion board: How might capital...
-
Berry uses a perpetual The inventories of Berry Company for the years 2 0 1 9 and 2 0 2 0 are as follows: Cost NRV January 1 , 2 0 1 9 $ 1 0 , 0 0 0 $ 1 0 , 0 0 0 December 3 1 , 2 0 1 9 1 3 , 0 0 0 1...
-
What can you tell just by looking at the yield curve?
-
3. [3 marks] Open the help file for the ifelse function in R and answer the following questions about this function: a. What argument must be a logical expression? b. What do the remaining two...
-
Define a traverse in Surveying?
-
Visit https://www.pmi.org/business-solutions/case-studies, choose a case study, and summarize it.
-
a. What are the aggregate demand forecast and aggregate safety stock for each week, and the aggregate initial inventory? b. Using the result of part a, and available hours during regular time (80...
-
Visit http://www.iihs.org/iihs/ratings to obtain recent crash-safety ratings for passenger vehicles. Next, answer these questions: a. Which vehicles received the highest ratings? b. What product...
-
Construct a frequency and relative frequency histogram of the five-year rate of- return data discussed in Example 3. Approach To draw the frequency histogram, use the frequency distribution in Table...
-
Construct a frequency and relative frequency histogram of the five-year rate of- return data discussed in Example 3. Approach We will use StatCrunch to construct the frequency and relative frequency...
-
The data in Table 14 represent the two-year average percentage of persons living in poverty, by state, for the years 20122013. Draw a stem-and-leaf plot of the data. Approach Step 1 Treat the integer...
Study smarter with the SolutionInn App