

Question: Construct a frequency and relative frequency histogram of the five-year rate of- return data discussed in Example 3. Approach We will use StatCrunch to construct
Construct a frequency and relative frequency histogram of the five-year rate of- return data discussed in Example 3.
Approach We will use StatCrunch to construct the frequency and relative frequency histograms. The steps for constructing the graphs using the TI-83/84 Plus graphing calculators, Minitab, Excel, and StatCrunch, are given in the Technology Step-by-Step.
Data from Example 3
Suppose you are considering investing in a Roth IRA. You collect the data in Table 12, which represent the five-year rate of return (in percent, adjusted for sales charges) for a simple random sample of 40 large-blended mutual funds. Construct a frequency and relative frequency distribution of the data.
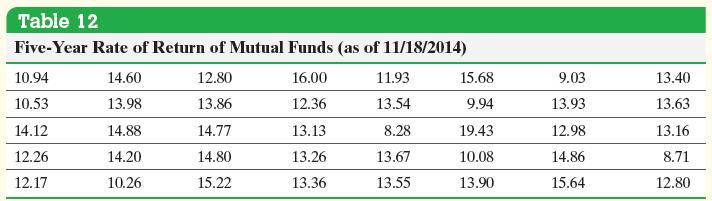
Table 12 Five-Year Rate of Return of Mutual Funds (as of 11/18/2014) 10.94 14.60 12.80 16.00 11.93 15.68 9.03 13.40 10.53 13.98 13.86 12.36 13.54 9.94 13.93 13.63 14.12 14.88 14.77 13.13 8.28 19.43 12.98 13.16 12.26 14.20 14.80 13.26 13.67 10.08 14.86 8.71 12.17 10.26 15.22 13.36 13.55 13.90 15.64 12.80
Step by Step Solution
There are 3 Steps involved in it
Figures 9 a and b sho... View full answer

Get step-by-step solutions from verified subject matter experts