

Question: Construct a frequency and relative frequency histogram of the five-year rate of- return data discussed in Example 3. Approach To draw the frequency histogram, use
Construct a frequency and relative frequency histogram of the five-year rate of- return data discussed in Example 3.
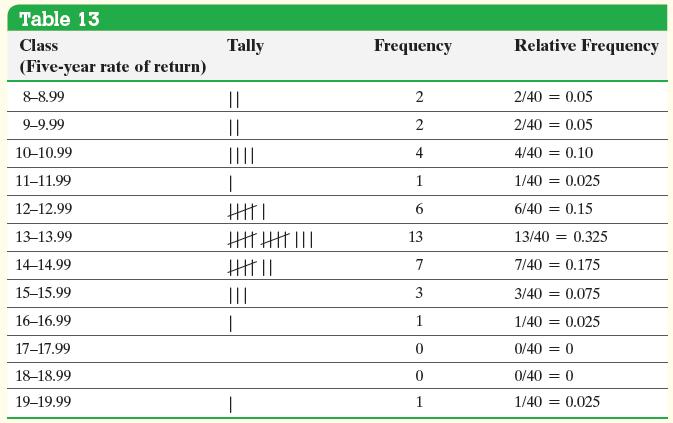
Approach To draw the frequency histogram, use the frequency distribution in Table 13. First, label the lower class limits of each class on the horizontal axis. Then, for each class, draw a rectangle whose width is the class width and whose height is the frequency. For the relative frequency histogram, the height of the rectangle is the relative frequency.
Data from Example 3
Suppose you are considering investing in a Roth IRA. You collect the data in Table 12, which represent the five-year rate of return (in percent, adjusted for sales charges) for a simple random sample of 40 large-blended mutual funds. Construct a frequency and relative frequency distribution of the data.
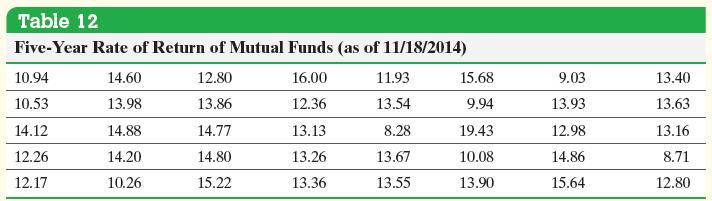
Table 13 Class (Five-year rate of return) Tally Frequency Relative Frequency 8-8.99 || 2 2/40 = 0.05 9-9.99 || 2 2/40 = 0.05 10-10.99 IIII 4 4/40 = 0.10 11-11.99 | 1 1/40 = 0.025 12-12.99 ||||| 6 6/40 = 0.15 13-13.99 ||||||||||| 13 13/40 = 0.325 14-14.99 |||||| 7 7/40 = 0.175 15-15.99 16-16.99 | 17-17.99 18-18.99 ||| 3 3/40 = 0.075 1 1/40 = 0.025 0 0/40 = 0 0 0/40 = 0 19-19.99 1 1/40 = 0.025
Step by Step Solution
3.34 Rating (154 Votes )
There are 3 Steps involved in it
Figures 8 a and ... View full answer

Get step-by-step solutions from verified subject matter experts