

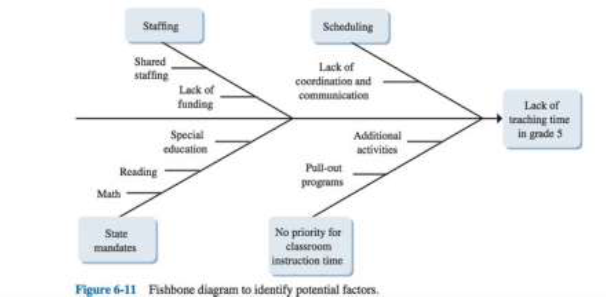
Question: Risk Analysis Cause and Effect Diagram (Fish-bone diagram) example What are the possible causes of the Lack of teaching time in grade 5? Figure 6-11
Risk Analysis
Cause and Effect Diagram (Fish-bone diagram) example
What are the possible causes of the Lack of teaching time in grade 5?
Step by Step Solution
There are 3 Steps involved in it
1 Expert Approved Answer
Step: 1 Unlock

Question Has Been Solved by an Expert!
Get step-by-step solutions from verified subject matter experts
Step: 2 Unlock
Step: 3 Unlock