

Question: Risv Aversion Score Client Maya Abdul 3 00 Assets Potential Risky Assets (P) Expected Returns o 13% 20% 3% A B 10% Cov(A,B) 0.21 Evaluate
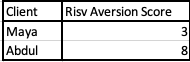
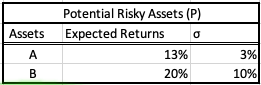
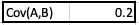

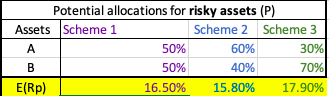

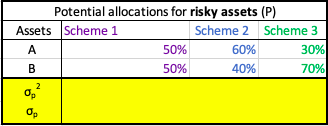


Risv Aversion Score Client Maya Abdul 3 00 Assets Potential Risky Assets (P) Expected Returns o 13% 20% 3% A B 10% Cov(A,B) 0.21 Evaluate the return of each of the weighting schemes for the risky portion of the portfolio. Calculate the expected return for each of the 3 senarios listed below. Potential allocations for risky assets (P) Assets Scheme 1 Scheme 2 Scheme 3 A 50% 60% 30% B 50% 40% 70% E(Rp) 16.50% 15.80% 17.90% Evaluate the standard deviation of each of the weighting schemes for the risky portion of the portfolio. Calculate the risk for each of the 3 senarios listed below. Potential allocations for risky assets (P) Assets Scheme 1 1 Scheme 2 Scheme 3 A 50% 60% 30% B 50% 40% 70% op? Op 1. Why are these standard deviations different from those of the risky assets individually? Your answer should reference covariance or correlation. 2. Which has the highest standard deviation? How would you interpret this in terms of utility? Risv Aversion Score Client Maya Abdul 3 00 Assets Potential Risky Assets (P) Expected Returns o 13% 20% 3% A B 10% Cov(A,B) 0.21 Evaluate the return of each of the weighting schemes for the risky portion of the portfolio. Calculate the expected return for each of the 3 senarios listed below. Potential allocations for risky assets (P) Assets Scheme 1 Scheme 2 Scheme 3 A 50% 60% 30% B 50% 40% 70% E(Rp) 16.50% 15.80% 17.90% Evaluate the standard deviation of each of the weighting schemes for the risky portion of the portfolio. Calculate the risk for each of the 3 senarios listed below. Potential allocations for risky assets (P) Assets Scheme 1 1 Scheme 2 Scheme 3 A 50% 60% 30% B 50% 40% 70% op? Op 1. Why are these standard deviations different from those of the risky assets individually? Your answer should reference covariance or correlation. 2. Which has the highest standard deviation? How would you interpret this in terms of utility
Step by Step Solution
There are 3 Steps involved in it

Get step-by-step solutions from verified subject matter experts