

Question: River Bottom Fire Department is evaluating their response River Bottom Fire Station Sample 1 2 3 4 5 6 7 8 9 10 11 12
River Bottom Fire Department is evaluating their response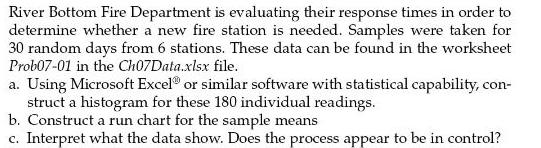
| River Bottom Fire Station |
| Sample | ||||||||||||||
| 1 | 2 | 3 | 4 | 5 | 6 | 7 | 8 | 9 | 10 | 11 | 12 | 13 | 14 | 15 |
| 3.81 | 4.08 | 4.19 | 3.88 | 4.15 | 4.95 | 4.01 | 4.85 | 4.24 | 4.99 | 4.07 | 4.71 | 3.91 | 4.60 | 4.57 |
| 3.93 | 3.82 | 4.30 | 4.16 | 4.93 | 4.12 | 4.89 | 4.05 | 4.87 | 4.16 | 4.88 | 3.98 | 4.64 | 3.94 | 4.06 |
| 3.89 | 3.98 | 4.17 | 4.12 | 4.86 | 4.08 | 4.87 | 4.08 | 5.33 | 4.16 | 4.89 | 4.04 | 4.68 | 4.00 | 3.95 |
| 3.91 | 4.21 | 4.23 | 4.24 | 4.98 | 4.23 | 4.98 | 3.98 | 4.83 | 4.18 | 4.86 | 3.94 | 4.57 | 3.85 | 3.96 |
| 4.08 | 4.00 | 4.12 | 4.17 | 4.58 | 4.12 | 4.89 | 4.07 | 4.93 | 4.29 | 4.93 | 3.94 | 4.57 | 3.86 | 3.98 |
| 4.01 | 4.06 | 4.15 | 4.17 | 4.97 | 4.13 | 4.88 | 3.95 | 4.83 | 4.37 | 4.97 | 3.90 | 4.52 | 3.88 | 3.95 |
| Sample | ||||||||||||||
| 16 | 17 | 18 | 19 | 20 | 21 | 22 | 23 | 24 | 25 | 26 | 27 | 28 | 29 | 30 |
| 4.19 | 4.08 | 4.00 | 4.16 | 5.03 | 4.16 | 4.92 | 4.09 | 4.95 | 4.11 | 4.80 | 3.95 | 4.59 | 3.90 | 4.58 |
| 4.19 | 4.08 | 4.04 | 4.14 | 4.89 | 4.14 | 4.90 | 4.12 | 4.93 | 4.16 | 4.90 | 3.90 | 4.57 | 3.87 | 4.58 |
| 4.03 | 4.21 | 4.06 | 4.19 | 4.88 | 4.19 | 4.91 | 4.10 | 4.82 | 3.93 | 4.63 | 3.93 | 4.59 | 3.88 | 4.64 |
| 4.06 | 4.22 | 4.10 | 4.17 | 4.92 | 4.06 | 4.84 | 4.14 | 4.89 | 4.03 | 4.68 | 4.01 | 4.72 | 4.00 | 4.66 |
| 3.88 | 4.18 | 4.01 | 4.02 | 4.85 | 4.18 | 4.98 | 4.14 | 4.85 | 4.01 | 4.63 | 4.10 | 4.80 | 4.01 | 4.66 |
| 4.00 | 4.10 | 4.13 | 4.31 | 5.13 | 4.31 | 5.09 | 4.27 | 5.03 | 4.14 | 4.76 | 4.01 | 4.65 | 4.02 | 4.75 |
River Bottom Fire Department is evaluating their response times in order to determine whether a new fire station is needed. Samples were taken for 30 random days from 6 stations. These data can be found in the worksheet Prob07-01 in the Ch07Data.xlsx file. a. Using Microsoft Excel or similar software with statistical capability, con- struct a histogram for these 180 individual readings. b. Construct a run chart for the sample means c. Interpret what the data show. Does the process appear to be in control?
Step by Step Solution
3.59 Rating (163 Votes )
There are 3 Steps involved in it
1 2 3 4 5 6 7 8 9 10 11 12 13 14 15 16 17 18 19 20 21 22 23 24 25 26 27 28 29 30 381 408 419 388 415 ... View full answer

Get step-by-step solutions from verified subject matter experts
Document Format (1 attachment)
61a8b952a00c6_86748.docx
120 KBs Word File