

Question: Row 1 0 1 3 15 15 5 5 7 7 Row 2 96 85 82 80 91 58 74 85 63 60 y =
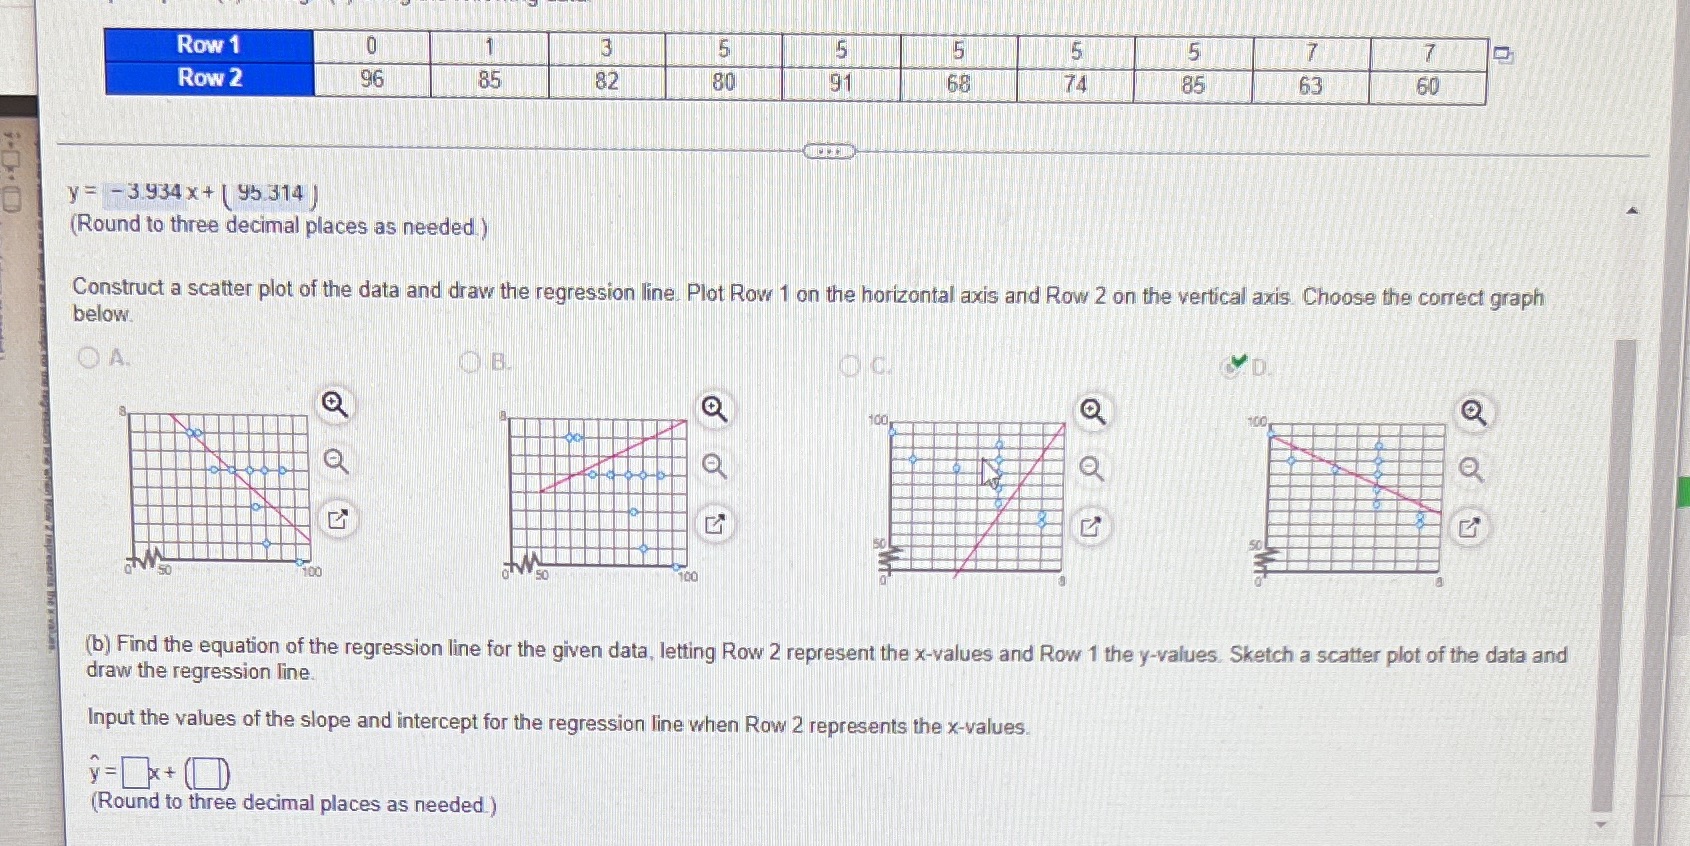

Row 1 0 1 3 15 15 5 5 7 7 Row 2 96 85 82 80 91 58 74 85 63 60 y = - 3.934 x+ (95.314 ) (Round to three decimal places as needed.) Construct a scatter plot of the data and draw the regression line. Plot Row 1 on the horizontal axis and Row 2 on the vertical axis. Choose the correct graph below. OA. OC. O 160 100 50 100 100 (b) Find the equation of the regression line for the given data, letting Row 2 represent the x-values and Row 1 the y-values. Sketch a scatter plot of the data and draw the regression line Input the values of the slope and intercept for the regression line when Row 2 represents the x-values. (Round to three decimal places as needed.)
Step by Step Solution
There are 3 Steps involved in it

Get step-by-step solutions from verified subject matter experts