

Question: S Geometry X Geometry X Geometry X S Geometry X Geometry X S 12.05 Reg X S Schoolog X S Schoolog X Course He X


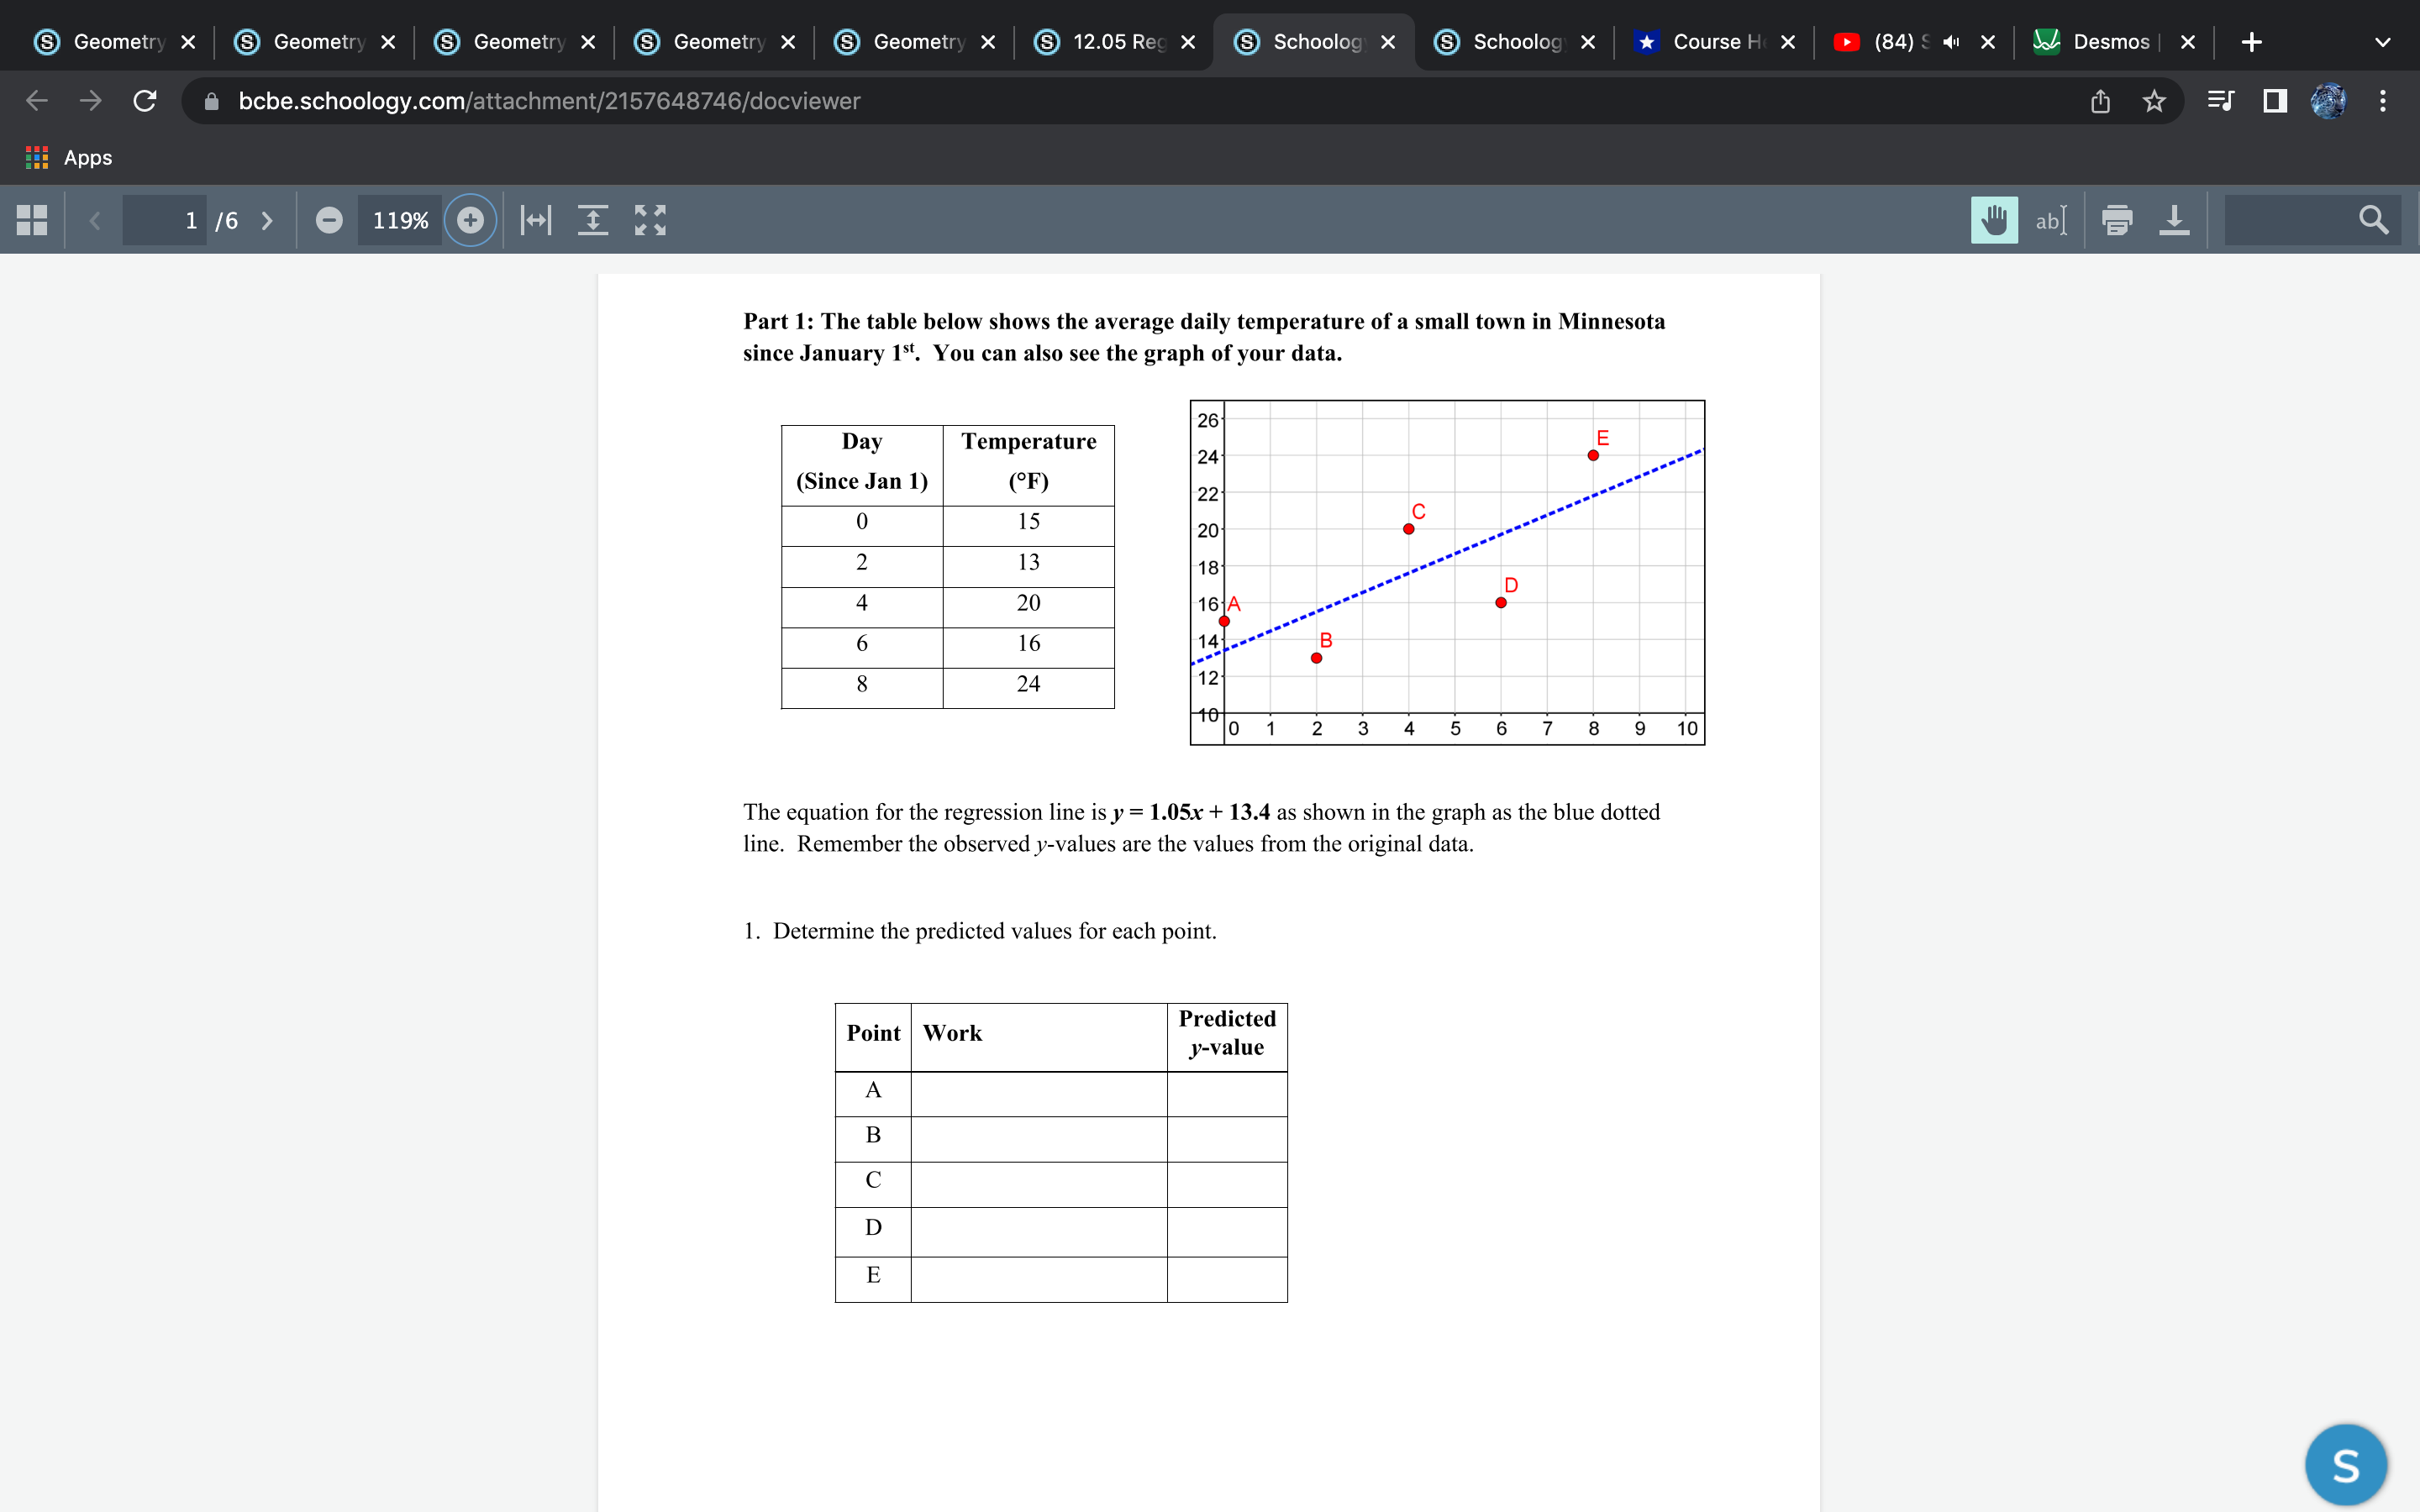
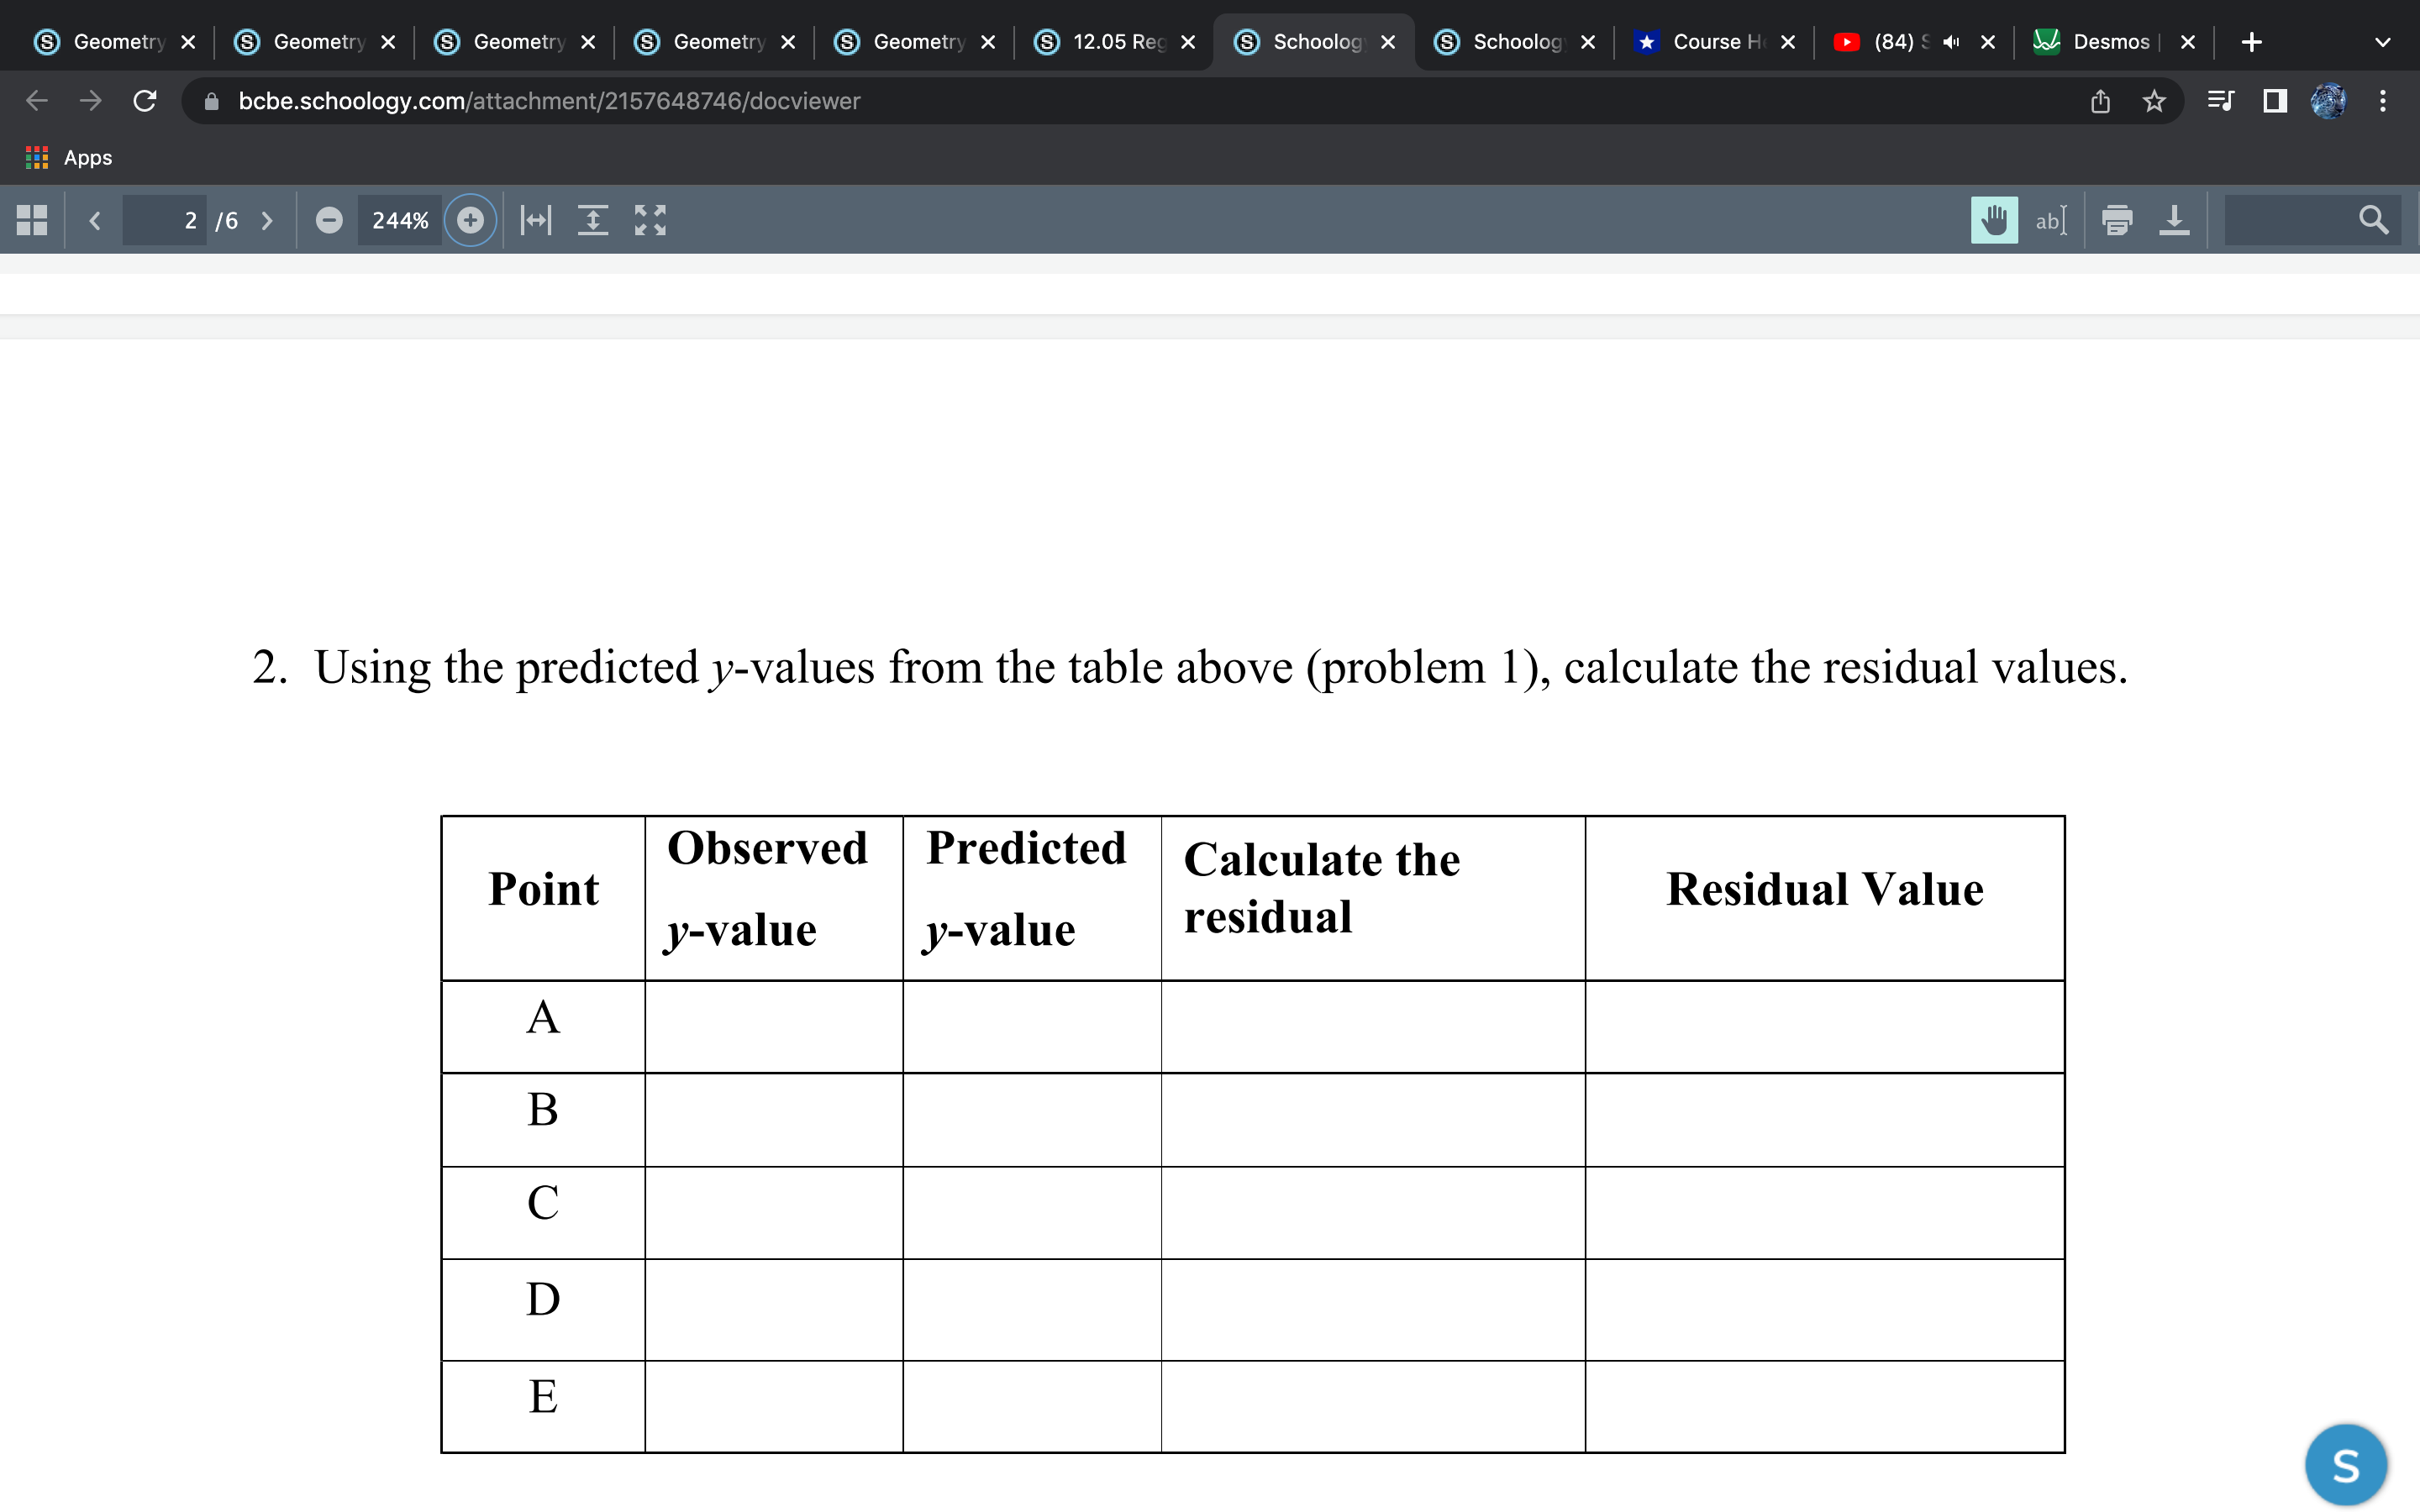
S Geometry X Geometry X Geometry X S Geometry X Geometry X S 12.05 Reg X S Schoolog X S Schoolog X Course He X (84) S 1 X Desmos X C bcbe.schoology.com/attachment/2157648746/docviewer Apps 1 /6 > 119% + + 23 ab Part 1: The table below shows the average daily temperature of a small town in Minnesota since January 1st. You can also see the graph of your data. 26 Day Temperature 241 (Since Jan 1) (F) 221 O 15 201 2 13 18 4 20 16 A 6 16 B 8 24 12 '0 1 2 3 4 5 6 7 8 9 10 The equation for the regression line is y = 1.05x + 13.4 as shown in the graph as the blue dotted line. Remember the observed y-values are the values from the original data. 1. Determine the predicted values for each point. Point Work Predicted y-value A B C D F SS Geometry X Geometry X Geometry X S Geometry X Geometry X S 12.05 Reg X S Schoolog X S Schoolog X Course He X (84) S 1 X Desmos X C bcbe.schoology.com/attachment/2157648746/docviewer Apps 2 /6 > 244% + ab 2. Using the predicted y-values from the table above (problem 1), calculate the residual values. Observed Predicted Point Calculate the Residual Value y-value y-value residual A B C D F S
Step by Step Solution
There are 3 Steps involved in it

Get step-by-step solutions from verified subject matter experts