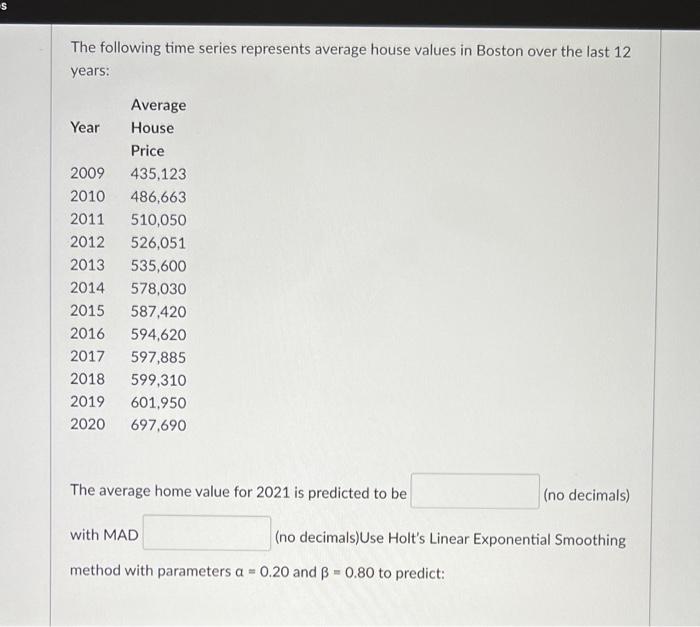
Question: S The following time series represents average house values in Boston over the last 12 years: Year 2009 2010 2011 2012 2013 2014 2015 2016

S The following time series represents average
S The following time series represents average house values in Boston over the last 12 years: Year 2009 2010 2011 2012 2013 2014 2015 2016 2017 2018 2019 2020 Average House Price 435,123 486,663 510,050 526,051 535,600 578,030 587,420 594,620 597,885 599,310 601,950 697,690 The average home value for 2021 is predicted to be (no decimals) with MAD (no decimals)Use Holt's Linear Exponential Smoothing method with parameters a 0.20 and B -0.80 to predict

Step by Step Solution

There are 3 Steps involved in it

1 Expert Approved Answer
Step: 1 Unlock blur-text-image
Question Has Been Solved by an Expert!

Get step-by-step solutions from verified subject matter experts

Step: 2 Unlock
Step: 3 Unlock

Students Have Also Explored These Related General Management Questions!