

Question: - Graph and clearly identify the feasible region - Label each constraint - Graph and label two iso-cost lines, and clearly identify the improving direction
- Graph and clearly identify the feasible region - Label each constraint - Graph and label two iso-cost lines, and clearly identify the improving direction - Identify the optimal solution, the objective function value, and the constraints that are binding at the optimal solution (if no optimal solution exists, indicate if the problem is infeasible or unbounded)
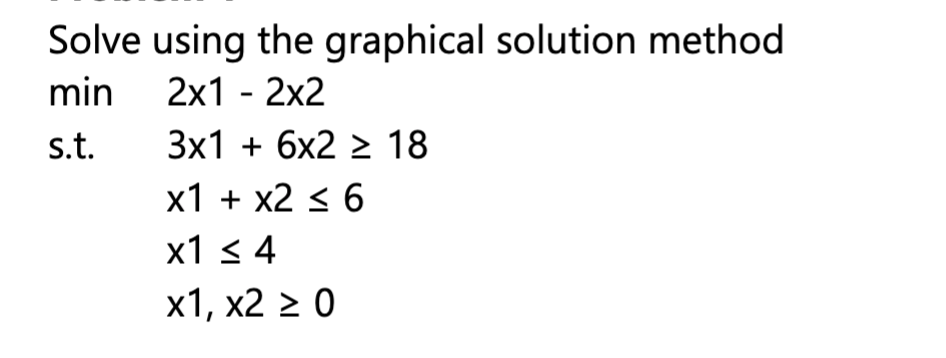
Solve using the graphical solution method min 2x1 - 2x2 s.t. 3x1 + 6x2 > 18 x1 + x2 0Step by Step Solution
There are 3 Steps involved in it
1 Expert Approved Answer
Step: 1 Unlock

Question Has Been Solved by an Expert!
Get step-by-step solutions from verified subject matter experts
Step: 2 Unlock
Step: 3 Unlock