

Question: Sales Bar Chart - Write a program that asks the user to enter today's sales for each of three stores. The program should then produce
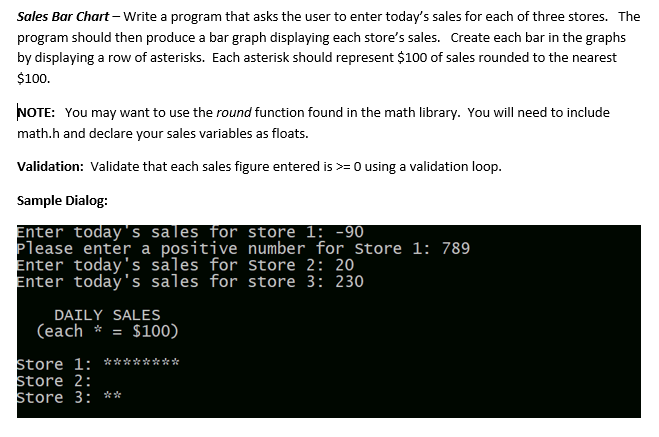
Sales Bar Chart - Write a program that asks the user to enter today's sales for each of three stores. The program should then produce a bar graph displaying each store's sales. Create each bar in the graphs by displaying a row of asterisks. Each asterisk should represent $100 of sales rounded to the nearest $100. NOTE: You may want to use the round function found in the math library. You will need to include math.h and declare your sales variables as floats. Validation: Validate that each sales figure entered is >= 0 using a validation loop. Sample Dialog: Enter today's sales for store 1: -90 please enter a positive number for store 1: 789 Enter today's sales for store 2: 20 Enter today's sales for store 3: 230 DAILY SALES (each * $100) Store 1: ******** store 2: Store 3: **
Step by Step Solution
There are 3 Steps involved in it

Get step-by-step solutions from verified subject matter experts