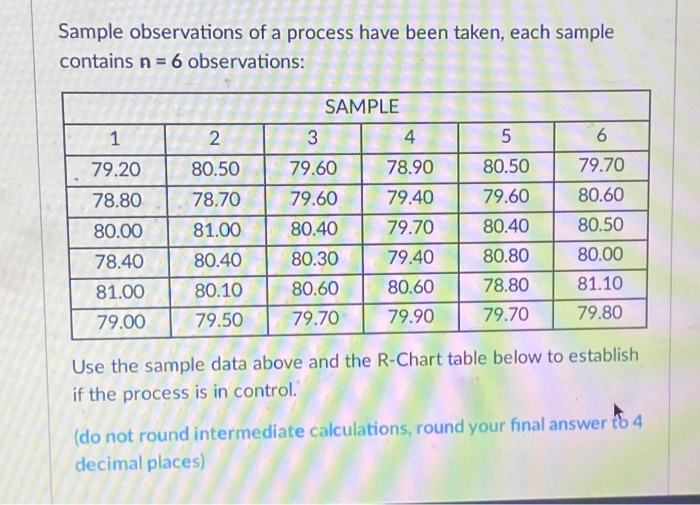
Question: Sample observations of a process have been taken, each sample contains n = 6 observations: SAMPLE 3 4 1 2 5 6 79.20 80.50 78.80

Sample observations of a process have been taken,
Sample observations of a process have been taken, each sample contains n = 6 observations: SAMPLE 3 4 1 2 5 6 79.20 80.50 78.80 80.00 79.60 79.60 80.40 79.60 80.40 80.50 78.70 81.00 80.40 80.10 79.50 78.90 79.40 79.70 79.40 80.60 79.90 79.70 80.60 80.50 80.00 81.10 79.80 78.40 80.80 81.00 80.30 80.60 79.70 78.80 79.70 79.00 Use the sample data above and the R-Chart table below to establish if the process is in control. (do not round intermediate calculations, round your final answer to 4 decimal places) Number of Observations in Subgroup, n 2 3 4 5 6 7 8 9 10 11 12 13 14 15 16 17 18 19 20 Factor for x Chart, A2 1.88 1.02 0.73 0.58 0.48 0.42 0.37 0.34 0.31 0.29 0.27 0.25 0.24 0.22 0.21 0.20 0.19 0.19 0.18 Lower Upper Control Limit, Control Limit, D3 D4 0 3.27 0 2.57 0 2.28 0 2.11 0 2.00 0.08 1.92 0.14 1.86 0.18 1.82 0.22 1.78 0.26 1.74 0.28 1.72 0.31 1.69 0.33 1.67 0.35 1.65 0.36 1.64 0.38 1.62 0.39 1.61 1.60 0.41 1.59 0.40 The Process is in Control The Process is NOT in Control

Step by Step Solution

There are 3 Steps involved in it

1 Expert Approved Answer
Step: 1 Unlock blur-text-image
Question Has Been Solved by an Expert!

Get step-by-step solutions from verified subject matter experts

Step: 2 Unlock
Step: 3 Unlock

Students Have Also Explored These Related General Management Questions!