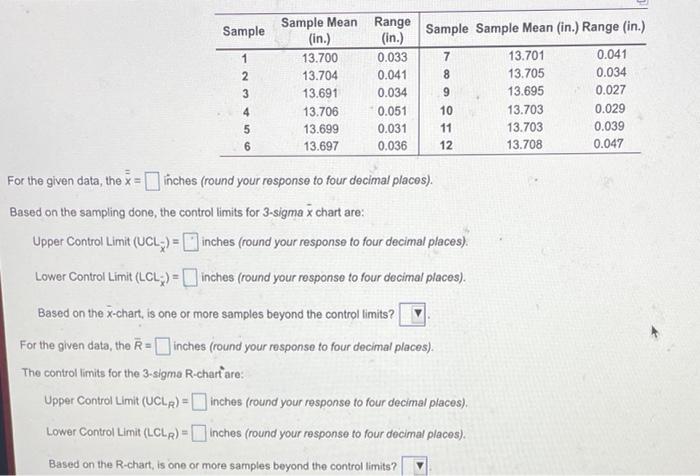
Question: Sample Sample Sample Mean (in.) Range (in.) 7 1 2 3 Sample Mean (in.) 13.700 13.704 13.691 13.706 13.699 13.697 Range (in.) 0.033 0.041 0.034

Sample Sample Sample Mean (in.) Range (in.) 7 1 2
Sample Sample Sample Mean (in.) Range (in.) 7 1 2 3 Sample Mean (in.) 13.700 13.704 13.691 13.706 13.699 13.697 Range (in.) 0.033 0.041 0.034 0.051 0.031 0.036 8 9 13.701 13.705 13.695 13.703 13.703 13.708 0.041 0.034 0.027 0.029 0.039 0.047 4 5 6 10 11 12 For the given data, the X - inches (round your response to four decimal places). Based on the sampling done, the control limits for 3-sigma x chart are: Upper Control Limit (UCL) = inches (round your response to four decimal places). Lower Control Limit (LCLz) - inches (round your response to four decimal places). Based on the x-chart, is one or more samples beyond the control limits? For the given data, the R-inches (round your response to four decimal places) The control limits for the 3-sigma R-chartare: Upper Control Limit (UCLR) - inches (round your response to four decimal places). Lower Control Limit (LCLR) - inches (round your response to four decimal places). Based on the R-chart, is one or more samples beyond the control limits

Step by Step Solution

There are 3 Steps involved in it

1 Expert Approved Answer
Step: 1 Unlock blur-text-image
Question Has Been Solved by an Expert!

Get step-by-step solutions from verified subject matter experts

Step: 2 Unlock
Step: 3 Unlock

Students Have Also Explored These Related General Management Questions!