

Question: I NEED HELP ON THE WHOLE QUESTION. THE SECOND PICTURE IS THE OTHER PART OF THE QUESTION THAT I ALSO NEED HELP IN. THANK YOU!
I NEED HELP ON THE WHOLE QUESTION. THE SECOND PICTURE IS THE OTHER PART OF THE QUESTION THAT I ALSO NEED HELP IN. THANK YOU!
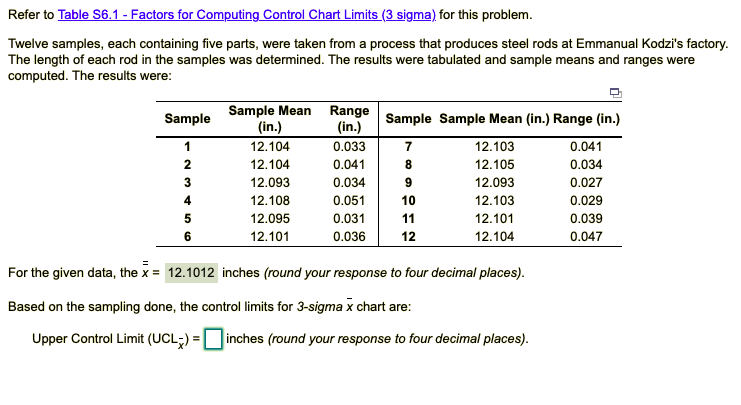
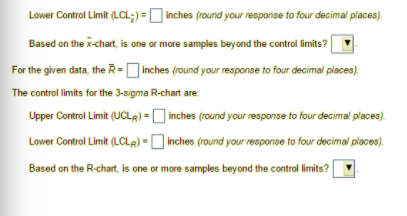
Refer to Table S6.1 - Factors for Computing Control Chart Limits (3 sigma) for this problem. Twelve samples, each containing five parts, were taken from a process that produces steel rods at Emmanual Kodzi's factory. The length of each rod in the samples was determined. The results were tabulated and sample means and ranges were computed. The results were: Sample 1 2 3 4 5 6 Sample Mean Range (in.) (in.) 12.104 0.033 12.104 0.041 12.093 0.034 12.108 0.051 12.095 0.031 12.101 0.036 Sample Sample Mean (in.) Range (in.) 7 12.103 0.041 12.105 0.034 9 12.093 0.027 10 12.103 0.029 11 12.101 0.039 12 12.104 0.047 For the given data, the x = 12.1012 inches (round your response to four decimal places). Based on the sampling done, the control limits for 3-sigma x chart are: Upper Control Limit (UCL;) - inches (round your response to four decimal places). Lower Control Limit (LCL;) - inches (round your response to four decimal places). Based on the x-chart, is one or more samples beyond the control limits? For the given data, the Rainches (round your response to four decimal places). The control limits for the 3-sigma R-chart are Upper Control Limit (UCLR) - inches (round your response to four decimal places) Lower Control Limit (LCLR)- inches (round your response to four decimal places). Based on the R-chart, is one or more samples beyond the control limitsStep by Step Solution
There are 3 Steps involved in it
1 Expert Approved Answer
Step: 1 Unlock

Question Has Been Solved by an Expert!
Get step-by-step solutions from verified subject matter experts
Step: 2 Unlock
Step: 3 Unlock