

Question: Samples Observations 1 2 3 4 1 10 12 14 16 2 20 22 24 18 3 16 18 20 14 4 18 20 24
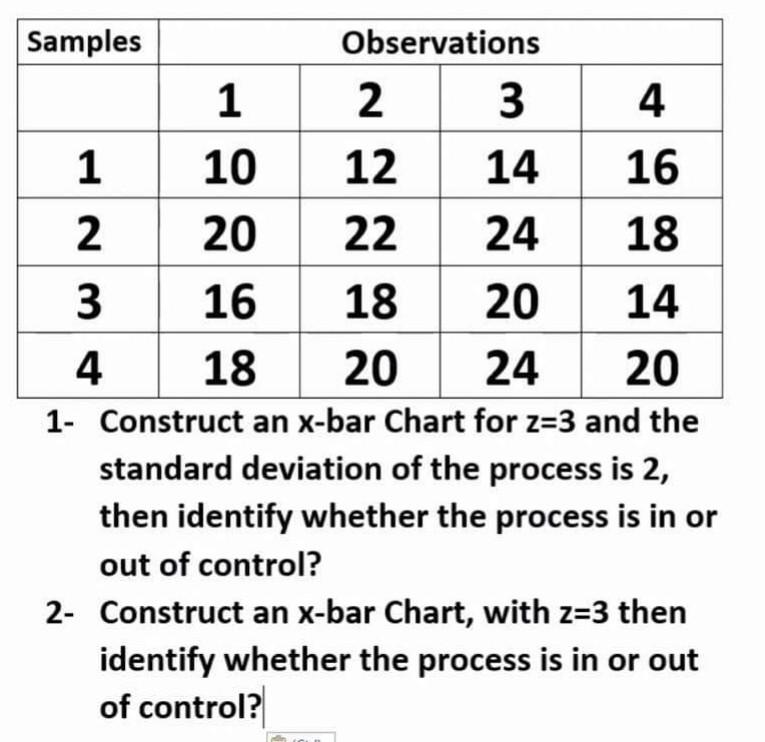
Samples Observations 1 2 3 4 1 10 12 14 16 2 20 22 24 18 3 16 18 20 14 4 18 20 24 20 1- Construct an x-bar Chart for z=3 and the standard deviation of the process is 2, then identify whether the process is in or out of control? 2- Construct an x-bar Chart, with z=3 then identify whether the process is in or out of control
Step by Step Solution
There are 3 Steps involved in it
1 Expert Approved Answer
Step: 1 Unlock

Question Has Been Solved by an Expert!
Get step-by-step solutions from verified subject matter experts
Step: 2 Unlock
Step: 3 Unlock