

Question: Scatterplot of Year_15 vs Year_3 Sex 190 F M 180 Year 15 170 160 150 90 95 100 105 Year 3
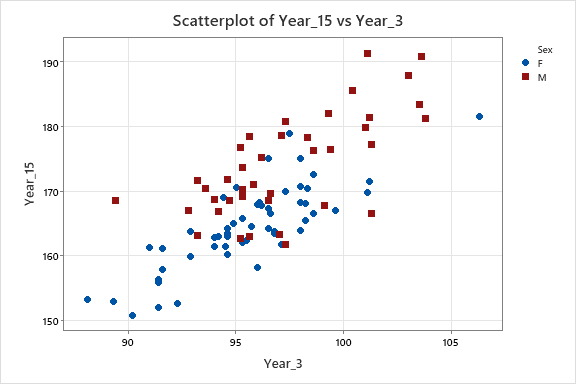
Scatterplot of Year_15 vs Year_3 Sex 190 F M 180 Year 15 170 160 150 90 95 100 105 Year 3
Step by Step Solution
There are 3 Steps involved in it
1 Expert Approved Answer
Step: 1 Unlock

Question Has Been Solved by an Expert!
Get step-by-step solutions from verified subject matter experts
Step: 2 Unlock
Step: 3 Unlock