

Question: $ Scenario In the Module Overview, we stated that an aggregate plan will include the quantity and timing of production for the intermediate future (typically
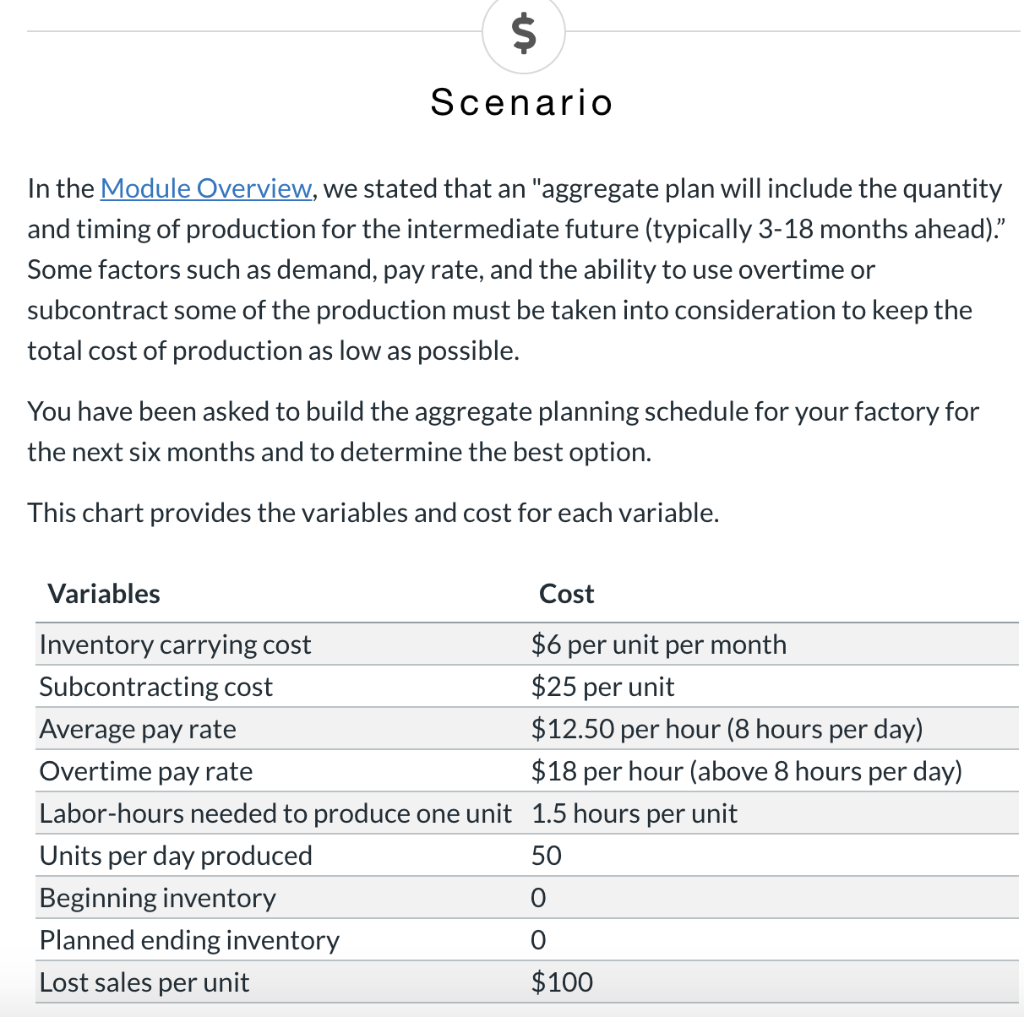
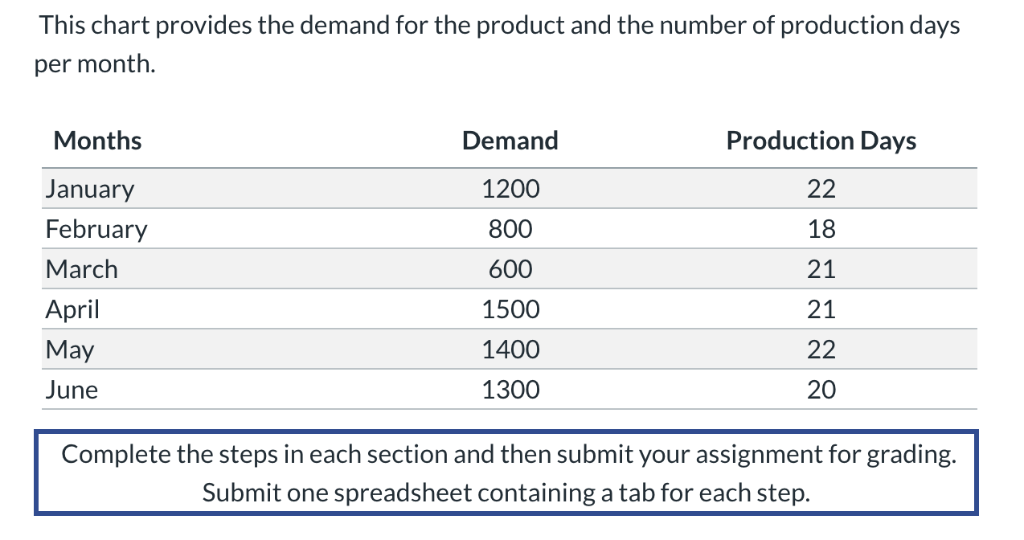
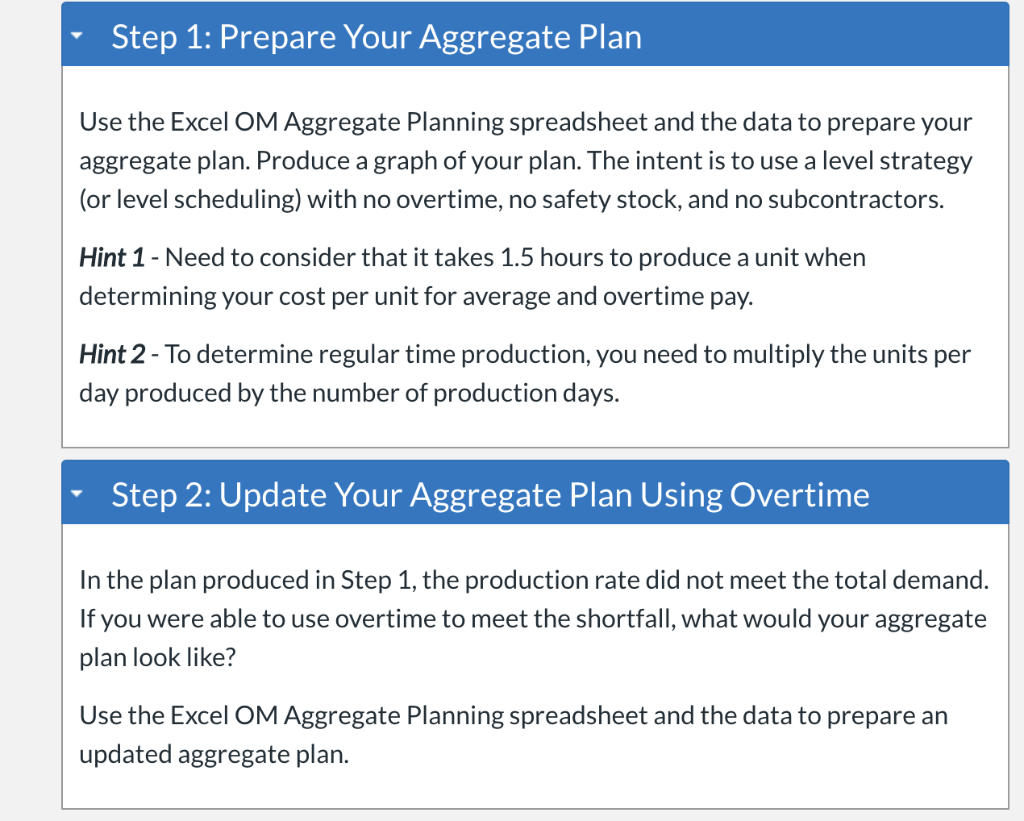
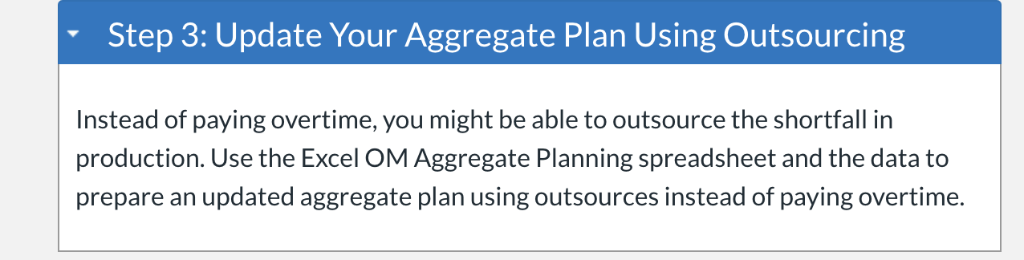
$ Scenario In the Module Overview, we stated that an "aggregate plan will include the quantity and timing of production for the intermediate future (typically 3-18 months ahead)." Some factors such as demand, pay rate, and the ability to use overtime or subcontract some of the production must be taken into consideration to keep the total cost of production as low as possible. You have been asked to build the aggregate planning schedule for your factory for the next six months and to determine the best option. This chart provides the variables and cost for each variable. Variables Cost $6 per unit per month Inventory carrying cost $25 per unit Subcontracting cost $12.50 per hour (8 hours per day) Average pay rate $18 per hour (above 8 hours per day) Overtime pay rate Labor-hours needed to produce one unit 1.5 hours per unit Units per day produced 50 Beginning inventory Planned ending inventory $100 Lost sales per unit This chart provides the demand for the product and the number of production days per month. Production Days Months Demand January 1200 22 February 800 18 March 600 21 April 21 1500 May 22 1400 June 1300 20 Complete the steps in each section and then submit your assignment for grading. Submit one spreadsheet containing a tab for each step. Step 1: Prepare Your Aggregate Plan Use the Excel OM Aggregate Planning spreadsheet and the data to prepare your aggregate plan. Produce a graph of your plan. The intent is to use a level strategy (or level scheduling) with no overtime, safety stock, and no subcontractors. no Hint 1 - Need to consider that it takes 1.5 hours to produce a unit when determining your cost per unit for average and overtime pay. Hint 2 - To determine regular time production, you need to multiply the units per day produced by the number of production days. Step 2: Update Your Aggregate Plan Using Overtime In the plan produced in Step 1, the production rate did not meet the total demand. If you were able to use overtime to meet the shortfall, what would your aggregate plan look like? Use the Excel OM Aggregate Planning spreadsheet and the data to prepare an updated aggregate plan. Step 3: Update Your Aggregate Plan Using Outsourcing Instead of paying overtime, you might be able to outsource the shortfall in production. Use the Excel OM Aggregate Planning spreadsheet and the data to updated aggregate plan using outsources instead of paying overtime. prepare an
Step by Step Solution
There are 3 Steps involved in it

Get step-by-step solutions from verified subject matter experts