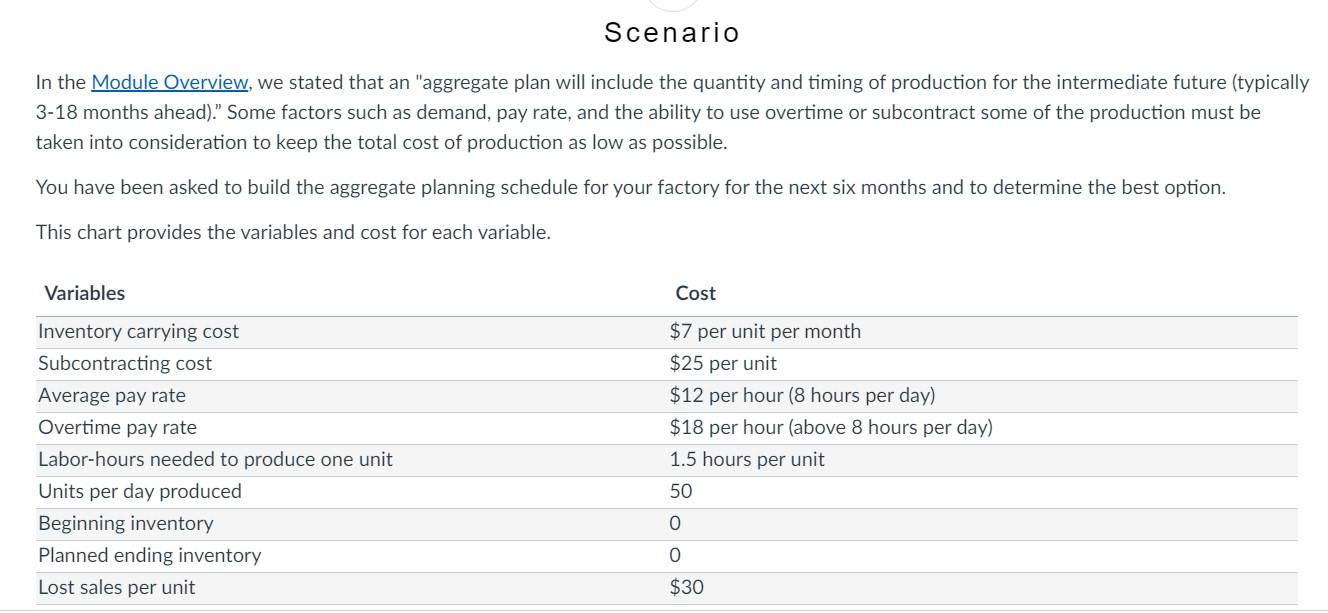
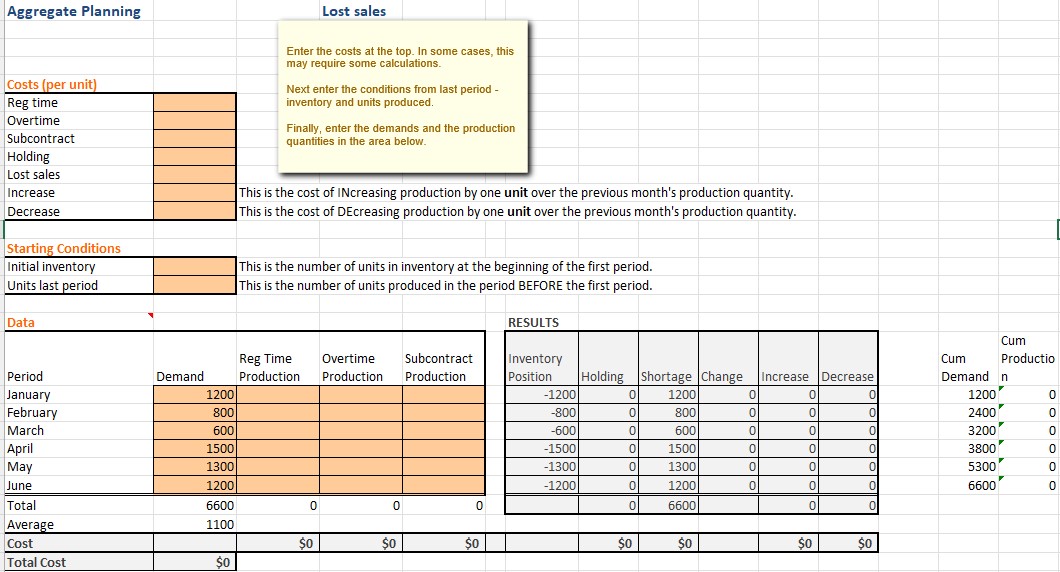
Question: Scenario In the Module Overview, we stated that an aggregate plan will include the quantity and timing of production for the intermediate future (typically 3-18

Scenario In the Module Overview, we stated thatScenario In the Module Overview, we stated thatScenario In the Module Overview, we stated thatScenario In the Module Overview, we stated thatScenario In the Module Overview, we stated thatScenario In the Module Overview, we stated thatScenario In the Module Overview, we stated thatScenario In the Module Overview, we stated thatScenario In the Module Overview, we stated thatScenario In the Module Overview, we stated that
Scenario In the Module Overview, we stated that an \"aggregate plan will include the quantity and timing of production for the intermediate future (typically 3-18 months ahead)." Some factors such as demand, pay rate, and the ability to use overtime or subcontract some of the production must be taken into consideration to keep the total cost of production as low as possible. You have been asked to build the aggregate planning schedule for your factory for the next six months and to determine the best option. This chart provides the variables and cost for each variable. Variables Cost Inventory carrying cost $7 per unit per month Subcontracting cost $25 per unit Average pay rate $12 per hour (8 hours per day} Overtime pay rate $18 per hour (above 8 hours per day] Labor-hours needed to produce one unit 1.5 hours per unit Units per day produced 50 Beginning inventory 0 Pianned ending inventory 0 Lost sales per unit $30 This chart provides the demand for the product and the number of production days per month. Months Demand Production Days January 1200 22 February 800 18 March 600 21 April 1500 21 May 1300 22 June 1200 20. Step 1: Prepare YourAggregate Plan Use the Excel OM Aggregate Planning spreadsheet and the data to prepare your aggregate plan. Produce a graph of your plan. The intent is to use a level strategy (or level scheduling) with no overtime, no safety stock. and no subcontractors. Hint 1 - Consider that it takes 1.5 hours to produce a unit when determining your cost per unit for average and overtime pay. Hint 2 - To determine regular time production, you need to multiply the units per day produced by the number of production days. Continue to Step 2: Update Your Aggregate Plan Using Overtime In the plan produced in Step 1. the production rate did not meet the total demand. If you were able to use overtime to meet the shortfall, what would your aggregate plan look like? Use the Excel OM Aggregate Planning spreadsheet and the data to prepare an updated aggregate plan. Continue to Step 3: Update Your Aggregate Plan Using Outsourcing - Step 3: Update Your Aggregate Plan Using Outsourcing Instead of paying overtime, you might be able to outsource the shortfall in production. Use the Excel OM Aggregate Planning spreadsheet and the data to prepare an updated aggregate plan using outsources instead of paying overtime. Continue to Step 4: Summarize and Submit On a fourth tab of the spreadsheet, summarize your cost and determine which of the three options produces the lowest overall cost. Be sure to provide a detailed analysis along with your summary data. Submit one spreadsheet containing a tab for each step. Save your assignment using a naming convention that includes your rst and last name and the activity number [or description). Do not add punctuation or special characters. Review the Problems Rubric for detailed grading information. Aggregate Planning Lost sales Enter the costs at the top. In some cases, this may require some calculations. Costs (per unit] Next enter the conditions from last period - Reg time inventory and units produced. Overtime Finally, enter the demands and the production Subcontract quantities in the area below. Holding Lost sales Increase This is the cost of INcreasing production by one unit over the previous month's production quantity. Decrease This is the cost of DEcreasing production by one unit over the previous month's production quantity. Starting Conditions Initial inventory This is the number of units in inventory at the beginning of the first period. Units last period This is the number of units produced in the period BEFORE the first period. Data RESULTS Cum Reg Time Overtime Subcontract Inventory Cum Productio Period Demand Production Production Production Position Holding Shortage |Change Demand n January 1200 1200 0 1200 1200 0 February 800 800 0 300 2400 0 March 600 600 600 3200 0 April 1500 1500 0 1500 3800 0 May 1300 1300 0 1300 5300 0 June 1200 -1200 1200 6600 O Total 6600 0 0 0 O 6600 Average 1100 Cost SO SO SO SO SO SO Total Cost SO\f\f\f\f\f

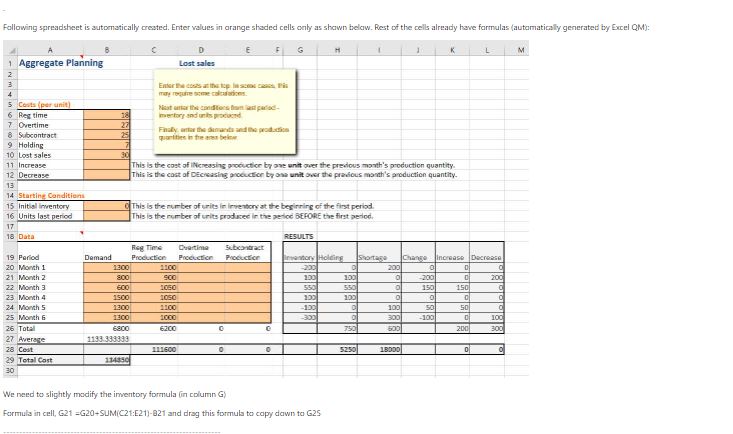
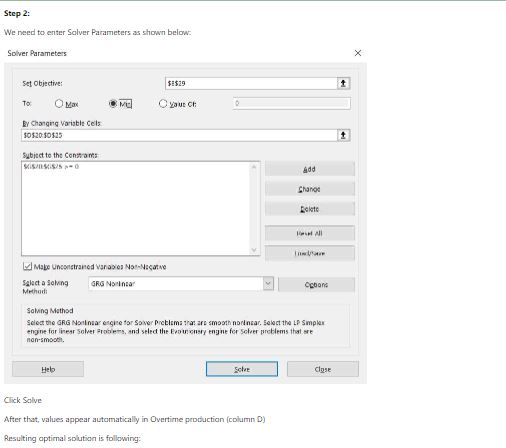
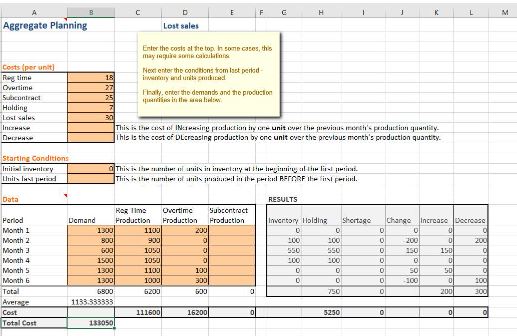
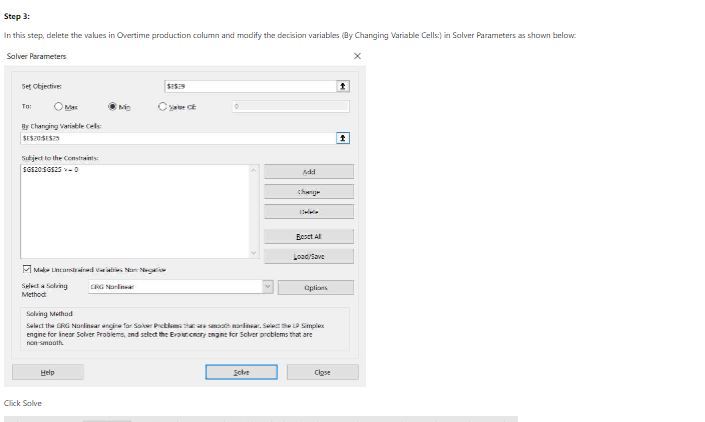
Step by Step Solution

There are 3 Steps involved in it

1 Expert Approved Answer
Step: 1 Unlock blur-text-image
Question Has Been Solved by an Expert!

Get step-by-step solutions from verified subject matter experts

Step: 2 Unlock
Step: 3 Unlock

Students Have Also Explored These Related General Management Questions!