

Choose either a bar graph or a line graph format and plot the data for Procedures II
Fantastic news! We've Found the answer you've been seeking!
Question:
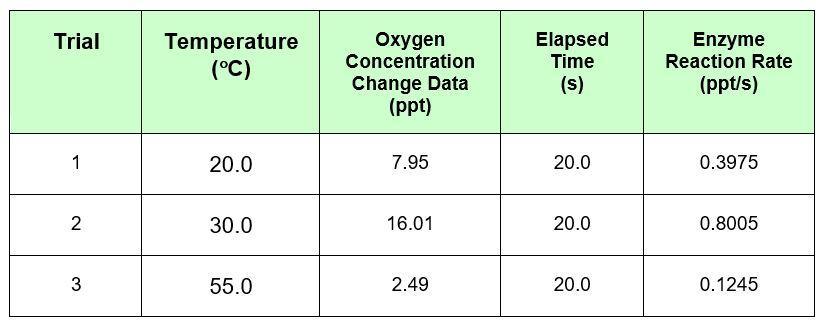
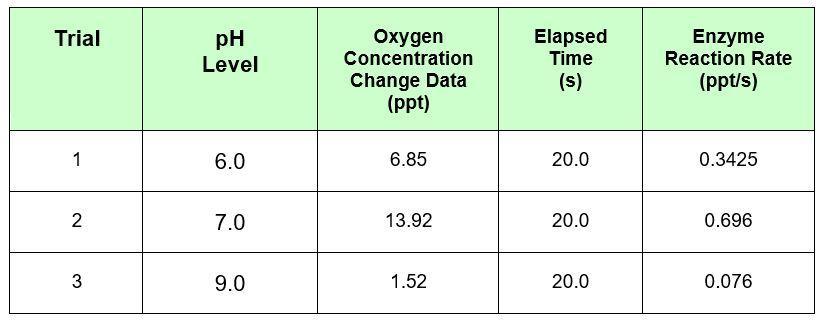
Choose either a bar graph or a line graph format and plot the data for Procedures II and III. Plot the data for each Procedure on a separate plot.
Procedure II
Procedure III
Expert Answer:

Related Book For 

Fundamentals of Financial Accounting
ISBN: 978-0078025914
5th edition
Authors: Fred Phillips, Robert Libby, Patricia Libby
Posted Date:
