

Question: * * * Second image is my current code, and the error message that shows for it . * * * Write a function plot
Second image is my current code, and the error message that shows for it
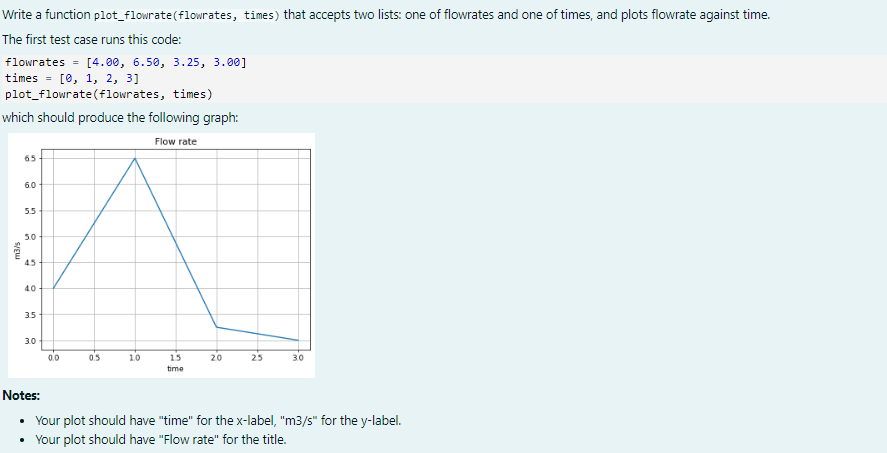
Write a function plotflowrateflowrates times that accepts two lists: one of flowrates and one of times, and plots flowrate against time.
The first test case runs this code:
flowrates
times
plotflowrateflowrates times
which should produce the following graph:
Notes:
Your plot should have "time" for the xlabel, ms for the ylabel.
Your plot should have "Flow rate" for the title.
import matplotlib.pyplot as plt
def plotflowrateflowrates times:
Plot flowrate against time."""
axes pltgca # Get the current Axes instance
axes.plottimes flowrates, o
axes.setxlabelTime
axes.setylabelms
axes.settitleFlow rate'
axes.gridTrue
pltshow
Precheck only
Failed, as follows.
You forgot to use the required function 'axes'.
Sorry, but your code doesn't pass the style checks.
Step by Step Solution
There are 3 Steps involved in it
1 Expert Approved Answer
Step: 1 Unlock

Question Has Been Solved by an Expert!
Get step-by-step solutions from verified subject matter experts
Step: 2 Unlock
Step: 3 Unlock