

Question: Section 2: Multiple choice questions 1. In a survey, 150 executives were asked what they think is the most common mistake candidates make during job
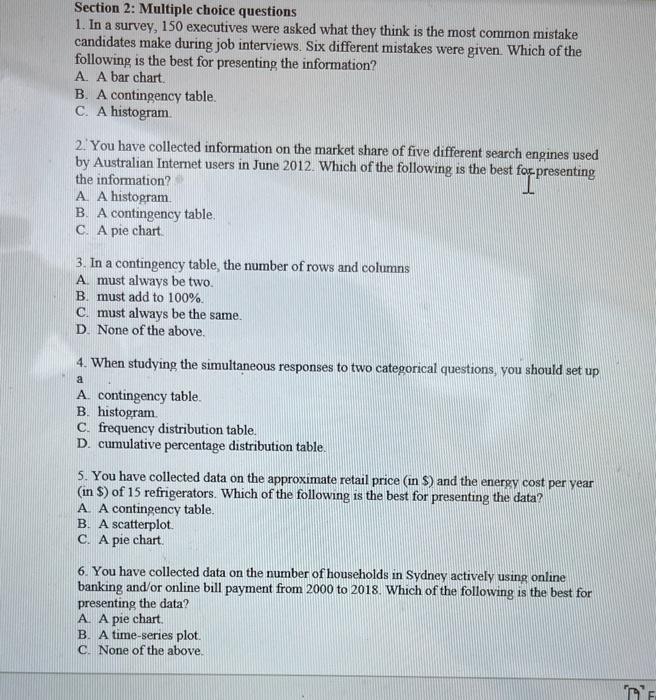
Section 2: Multiple choice questions 1. In a survey, 150 executives were asked what they think is the most common mistake candidates make during job interviews. Six different mistakes were given. Which of the following is the best for presenting the information? A. A bar chart B. A contingency table. C. A histogram 2. You have collected information on the market share of five different search engines used by Australian Internet users in June 2012. Which of the following is the best for presenting the information? A. A histogram B. A contingency table. C. A pie chart t faj pre 3. In a contingency table, the number of rows and columns A must always be two. B. must add to 100%. C. must always be the same. D. None of the above. 4. When studying the simultaneous responses to two categorical questions, you should set up A contingency table. B. histogram C. frequency distribution table. D. cumulative percentage distribution table. 5. You have collected data on the approximate retail price (in $) and the energy cost per year (in $) of 15 refrigerators. Which of the following is the best for presenting the data? A. A contingency table. B. A scatterplot. C. A pie chart 6. You have collected data on the number of households in Sydney actively using online banking and/or online bill payment from 2000 to 2018. Which of the following is the best for presenting the data? A. A pie chart B. A time-series plot. C. None of the above
Step by Step Solution
There are 3 Steps involved in it

Get step-by-step solutions from verified subject matter experts