

Question: Section 4: More 2d plot types Semilog A logarithmic axis is useful when data on one plot crosses multiple orders of magnitude (i.e. some
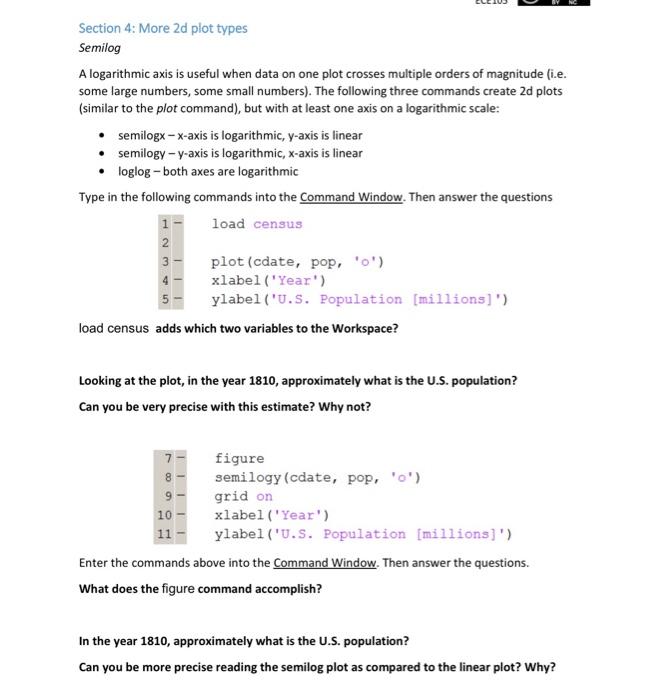
Section 4: More 2d plot types Semilog A logarithmic axis is useful when data on one plot crosses multiple orders of magnitude (i.e. some large numbers, some small numbers). The following three commands create 2d plots (similar to the plot command), but with at least one axis on a logarithmic scale: semilogx-x-axis is logarithmic, y-axis is linear semilogy -y-axis is logarithmic, x-axis is linear loglog - both axes are logarithmic Type in the following commands into the Command Window. Then answer the questions load census 123 1 T II 10 HT load census adds which two variables to the Workspace? I Looking at the plot, in the year 1810, approximately what is the U.S. population? Can you be very precise with this estimate? Why not? 789 III 11 plot (cdate, pop, '0') xlabel ('Year') ylabel ('U.S. Population [millions]') T 1 figure semilogy (cdate, pop, 'o') grid on xlabel('Year') ylabel('U.S. Population [millions]') Enter the commands above into the Command Window. Then answer the questions. What does the figure command accomplish? In the year 1810, approximately what is the U.S. population? Can you be more precise reading the semilog plot as compared to the linear plot? Why? Why is it advantageous to plot data with a large range of values on a logarithmic axis? Would it make sense to use a logarithmic x-axis for this example? Why or why not? The U.S. population appears to have a near-perfect exponential growth through year 1890 (straight line on the semilog plot). Make a conjecture as to why this tapers off in the last century: Plot gallery Perform an internet search for "types of MATLAB plots". Select the Mathworks link. How many different plot types are shown? What is the difference between a bar plot and a barh plot? Give an example of where an errorbar plot is useful: Give an example of where a compass plot is useful:
Step by Step Solution
3.32 Rating (152 Votes )
There are 3 Steps involved in it
The load census command adds the variables cdate and pop to the Workspace To estimate the US ... View full answer

Get step-by-step solutions from verified subject matter experts