

Question: SECTION B: STRUCTURE QUESTIONS (30 MARKS) QUESTION 1 (CLO2; C3) The table shows the total production of Goods A produced by Sepadujaya Enterprise in the
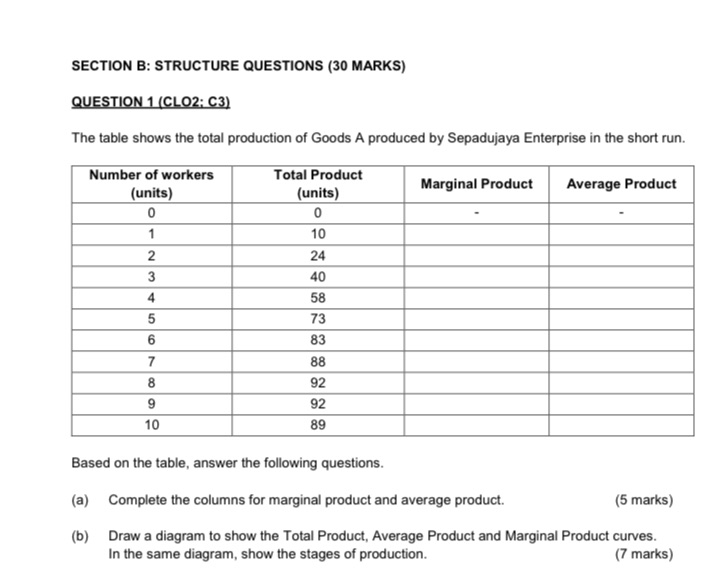
SECTION B: STRUCTURE QUESTIONS (30 MARKS) QUESTION 1 (CLO2; C3) The table shows the total production of Goods A produced by Sepadujaya Enterprise in the short run. Number of workers Total Product (units) (units) Marginal Product Average Product 0 0 10 2 24 3 40 58 73 83 88 92 92 10 89 Based on the table, answer the following questions. (a) Complete the columns for marginal product and average product. (5 marks) (b) Draw a diagram to show the Total Product, Average Product and Marginal Product curves. In the same diagram, show the stages of production. (7 marks)
Step by Step Solution
There are 3 Steps involved in it
1 Expert Approved Answer
Step: 1 Unlock

Question Has Been Solved by an Expert!
Get step-by-step solutions from verified subject matter experts
Step: 2 Unlock
Step: 3 Unlock