

Question: Section I: Multiple Choice Instructions: There may be anywhere from 0 to 5 correct answers for each question. Put an X in front of each

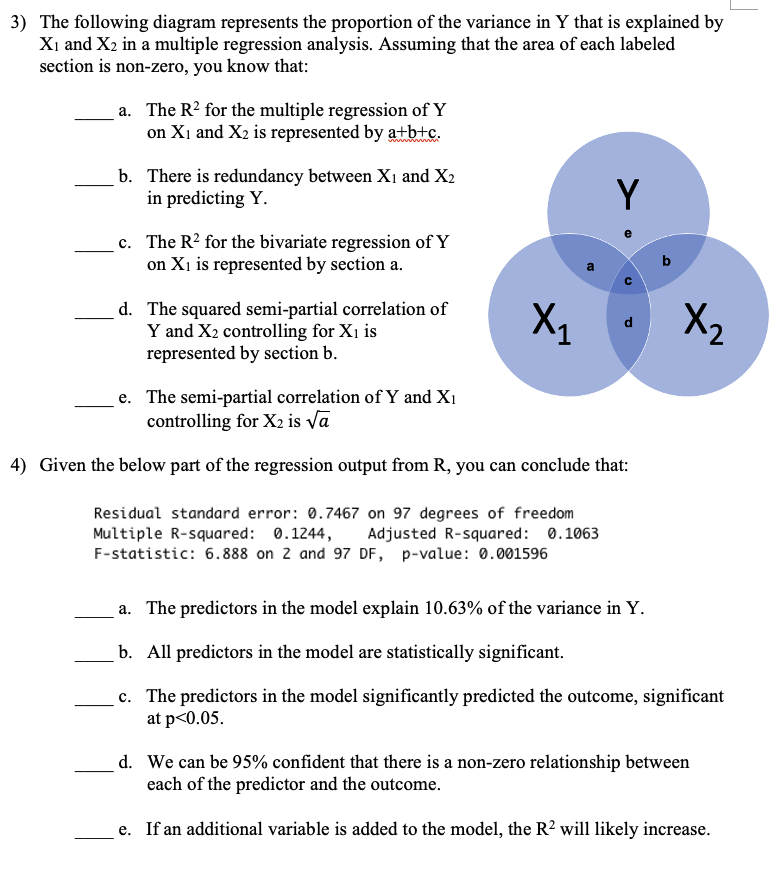


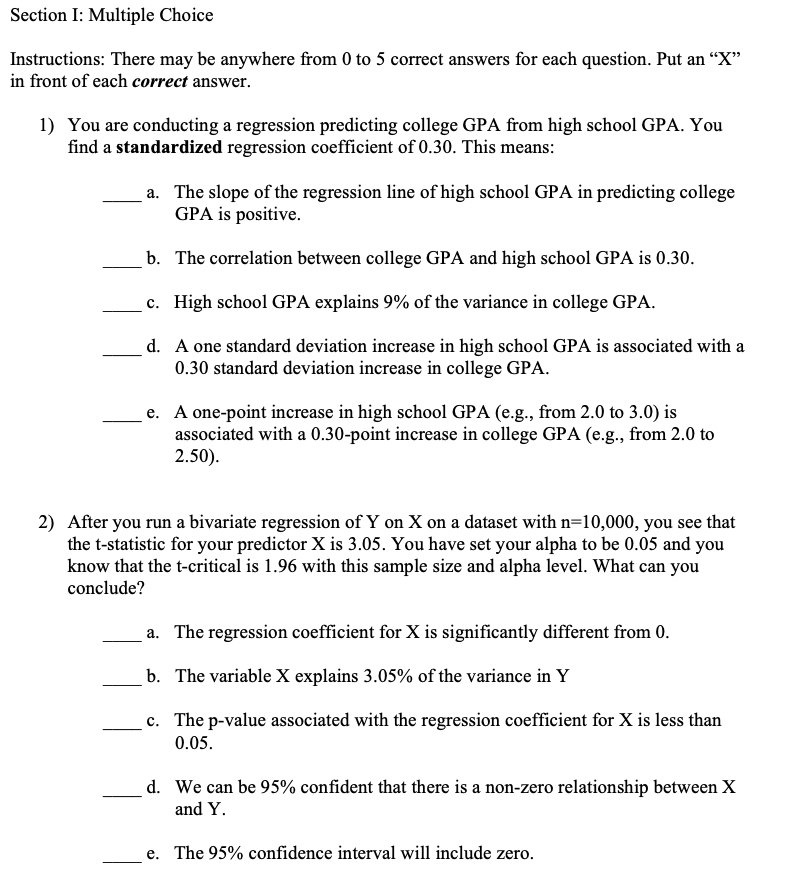

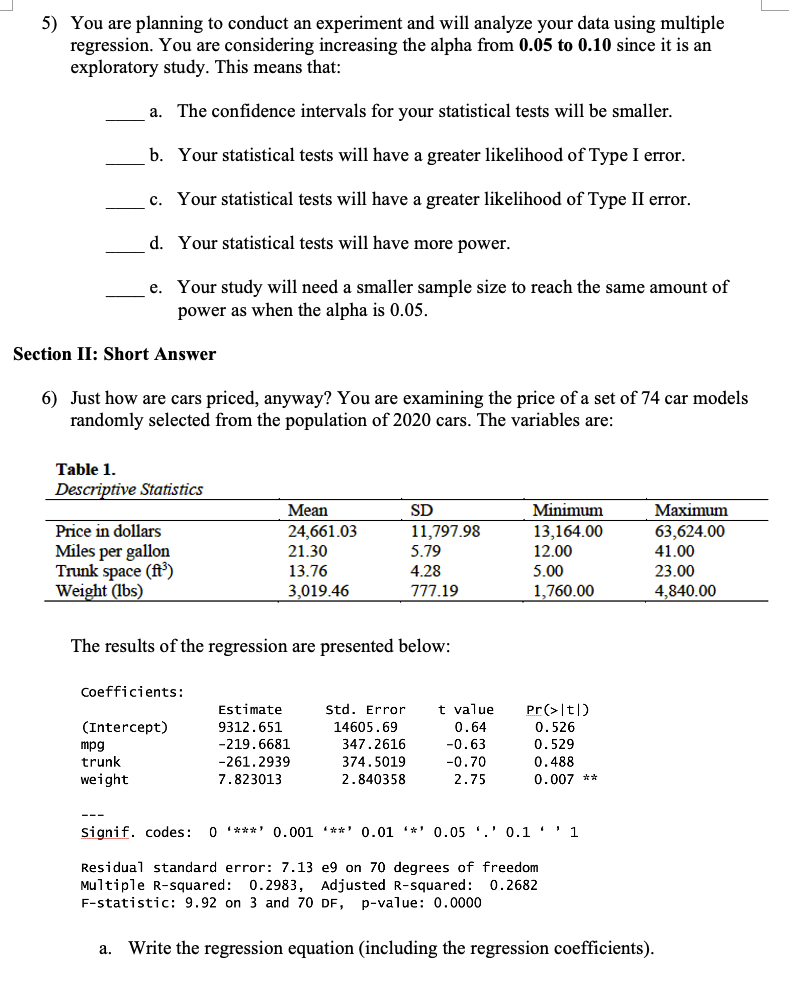
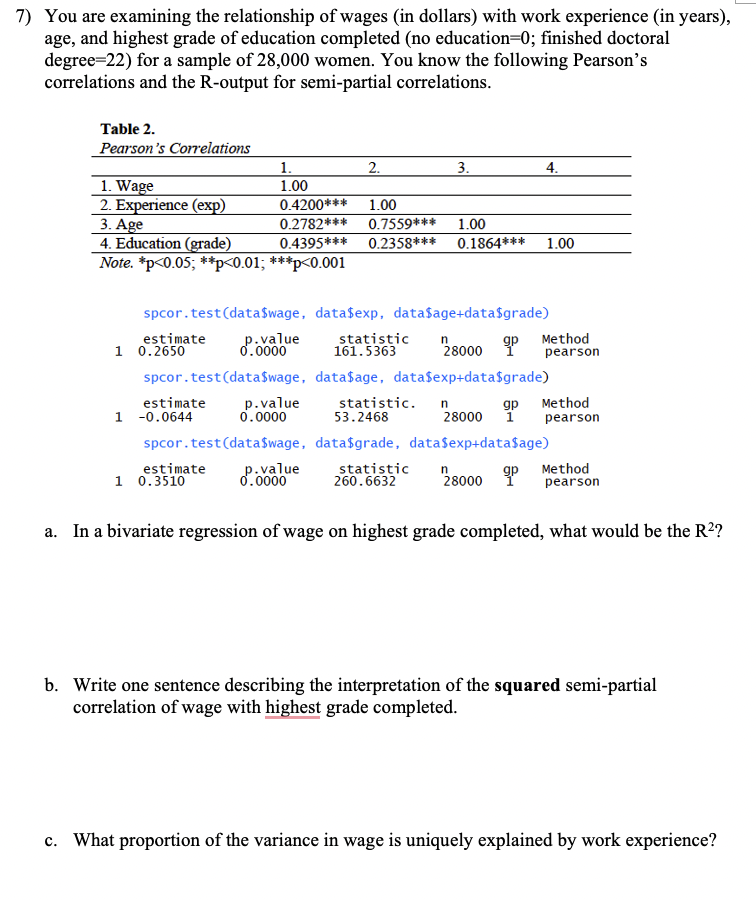
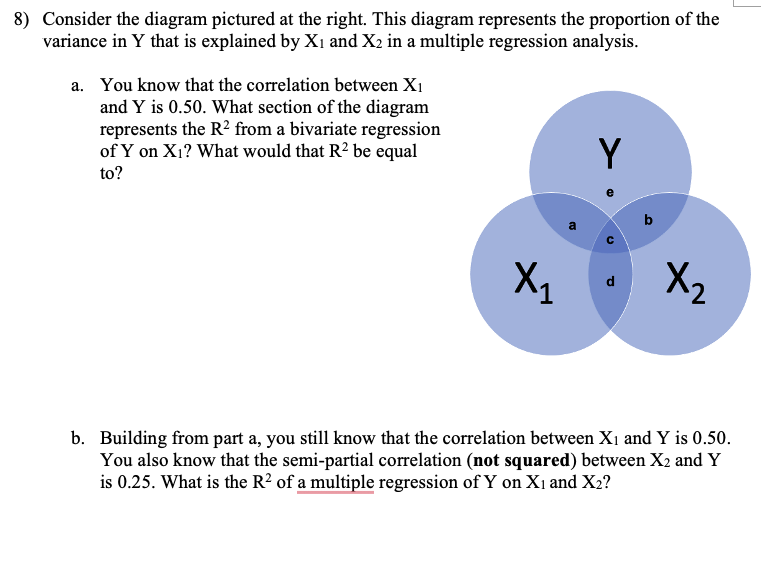
Section I: Multiple Choice Instructions: There may be anywhere from 0 to 5 correct answers for each question. Put an "X" in front of each correct answer. 1) You are conducting a regression predicting college GPA from high school GPA. You find a standardized regression coefficient of 0.30. This means: a. The slope of the regression line of high school GPA in predicting college GPA is positive. b. The correlation between college GPA and high school GPA is 0.30. c. High school GPA explains 9% of the variance in college GPA. d. A one standard deviation increase in high school GPA is associated with a 0.30 standard deviation increase in college GPA. e. A one-point increase in high school GPA (e.g., from 2.0 to 3.0) is associated with a 0.30-point increase in college GPA (e.g., from 2.0 to 2.50). 2) After you run a bivariate regression of Y on X on a dataset with n=10,000, you see that the t-statistic for your predictor X is 3.05. You have set your alpha to be 0.05 and you know that the t-critical is 1.96 with this sample size and alpha level. What can you conclude? a. The regression coefficient for X is significantly different from 0. b. The variable X explains 3.05% of the variance in Y c. The p-value associated with the regression coefficient for X is less than 0.05. d. We can be 95% confident that there is a non-zero relationship between X and Y. e. The 95% confidence interval will include zero.|_ 3) The following diagram represents the proportion of the variance in Y that is explained by X: and X2 in a multiple regression analysis. Assuming that the area of each labeled section is non-zero, you know that: a. The R2 for the multiple regression of Y on X1 and X2 is represented by am b. There is redundancy between X1 and X2 in predicting Y. c. The lit2 for the bivariate regression on on X1 is represented by section a. d. The squared semi-partial correlation of Y and X2 controlling for X1 is represented by section b. e. The semi-partial correlation of Y and X1 controlling for X2 is xiit 4) Given the belov..r part of the regression output from R, you can conclude that: Residual standard error: 3.?46? on 9? degrees of freedom Multiple R-squared: H.124\5) You are planning to conduct an experiment and will analyze your data using multiple regression. You are considering increasing Je alpha from 0.05 to 0.10 since it is an exploratory study. This means that: a. The condence intervals for your statistical tests will be smaller. h. Your statistical tests will have a greater likelihood of Type I error. c. Your statistical tests will have a greater likelihood of Type 11 error. (1. Your statistical tests will have more power. e. Your study will need a smaller sample size to reach the same amount of power as when the alpha is 0.05. Section II: Short Answer 6) Just how are cars priced, anyway? You are examining the price of a set of T4 car models randomly selected from the population of 2020 cars. The variables are: Thbkll llengjpyeusor Mean SD Minimum Maxinnnn Price in dollars 24,661.03 1 1,291.98 13,164.00 63,624.00 Miles per gallon 21.30 5.?9 12.00 41.00 Trunk space (113) 13.?6 4.28 5.00 23.00 Wg t (lbs) 3,019.46 272.19 1,260.00 4,840.00 The results of the regression are presented below: coefficients: Estimate Std. Error t value EECeItI) (Intercept) 9312.651 14605.59 0.54 0.525 mpg -210. 6631 34? . 2616 -0. 63 0. 52'51I trunk 261.2939 324.5019 0.?0 0.468 weight 2.323013 2-840358 2.25 0.00:1r 1\" Signif. codes: 0 '**'*' 0.001 '**' 0.01 \"'1' 0.05 '.' 0.1 ' ' 1 Residual standard error: ?.13 e9 on ?0 degrees of Freedom Multiple Rsquared: 0.2983, Adjusted Rsquared: 0.2632 F-statistic: 9.92 on 3 and 20 DF, payalue: 0.0000 a. Write the regression equation {including the regression coefcients). b. In no more than two sentences, describe the meaning of the coefficient on the weight variable and state its statistical significance. c. Interpret the intercept of this model. Does this intercept make sense? Why or why not? d. Interpret the R2 in one sentence. e. In one sentence, describe what the p-value associated with the f-statistic tells you about the model. f. Given that critical t=1.96, calculate the confidence interval for the weight regression coefficient.7) You are examining the relationship of wages (in dollars) with work experience (in years), age, and highest grade of education completed (no education=0; finished doctoral degree=22) for a sample of 28,000 women. You know the following Pearson's correlations and the R-output for semi-partial correlations. Table 2. Pearson's Correlations 1 . 2. 3. 4. 1. Wage 1.00 2. Experience (exp) 0.4200*** 1.00 3. Age 0.2782**# 0.7559**# 1.00 4. Education (grade) 0.4395*#* 0.2358**# 0.1864*** 1.00 Note. *p
Step by Step Solution
There are 3 Steps involved in it

Get step-by-step solutions from verified subject matter experts