

Question: See Table 2.5 E showing financial statement data and stock price data for Mydeco Corp. a. By what percentage did Mydeco's revenues grow each year
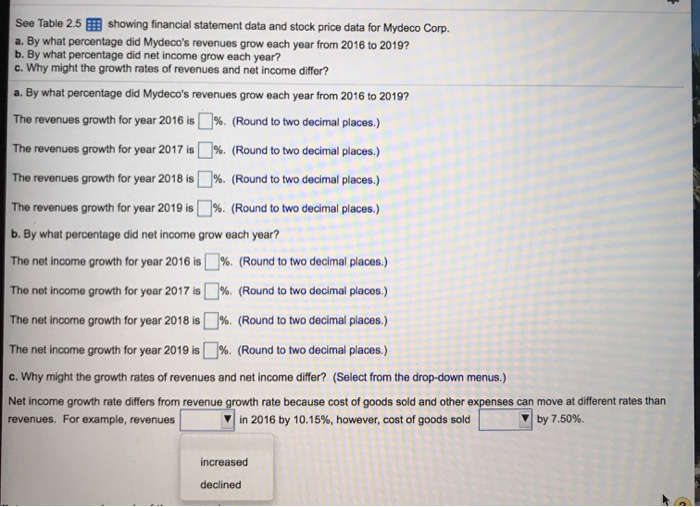
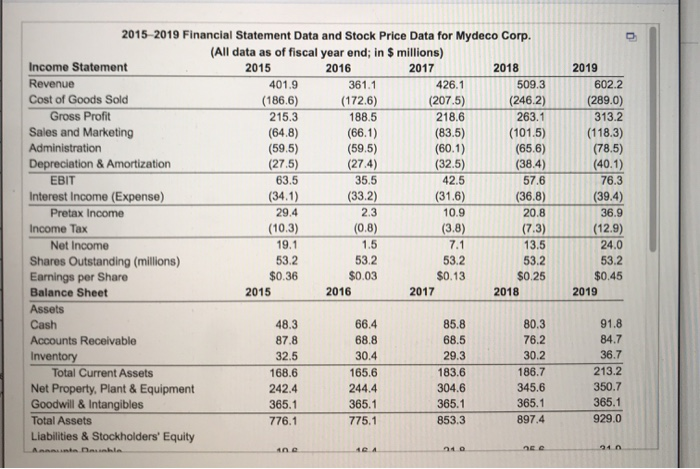
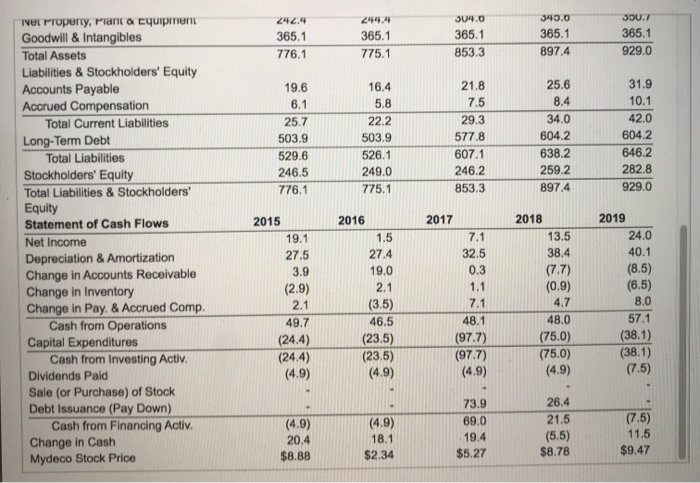
See Table 2.5 E showing financial statement data and stock price data for Mydeco Corp. a. By what percentage did Mydeco's revenues grow each year from 2016 to 2019? b. By what percentage did net income grow each year? c. Why might the growth rates of revenues and net income differ? a. By what percentage did Mydeco's revenues grow each year from 2016 to 2019? The revenues growth for year 2016 is %. (Round to two decimal places.) The revenues growth for year 2017 is %. (Round to two decimal places.) The revenues growth for year 2018 is %. (Round to two decimal places.) The revenues growth for year 2019 is %. (Round to two decimal places.) b. By what percentage did net income grow each year? The net income growth for year 2016 is %. (Round to two decimal places.) The net income growth for year 2017 is %(Round to two decimal places.) The net income growth for year 2018 is %. (Round to two decimal places.) The net income growth for year 2019 is %. (Round to two decimal places.) c. Why might the growth rates of revenues and net income differ? (Select from the drop-down menus.) Net income growth rate differs from revenue growth rate because cost of goods sold and other expenses can move at different rates than revenues. For example, revenues in 2016 by 10.15%, however, cost of goods sold by 7.50%. increased declined 2015-2019 Financial Statement Data and Stock Price Data for Mydeco Corp. (All data as of fiscal year end; in $ millions) Income Statement 2015 2016 2017 2018 Revenue 401.9 361.1 426.1 509.3 Cost of Goods Sold (186.6) (172.6) (207.5) (246.2) Gross Profit 215.3 188.5 218.6 263.1 Sales and Marketing (64.8) (66.1) (83.5) (101.5) Administration (59.5) (59.5) (60.1) (65.6) Depreciation & Amortization (27.5) (27.4) (32.5) (38.4) EBIT 63.5 35.5 42.5 57.6 Interest Income (Expense) (34.1) (33.2) (31.6) (36.8) Pretax Income 29.4 2.3 10.9 20.8 Income Tax (10.3) (0.8) (3.8) (7.3) Net Income 19.1 1.5 7.1 13.5 Shares Outstanding (millions) 53.2 53.2 53.2 53.2 Earnings per Share $0.36 $0.03 $0.13 $0.25 Balance Sheet 2015 2016 2017 2018 Assets Cash 48.3 66.4 85.8 80.3 Accounts Receivable 87.8 68.8 68.5 76.2 Inventory 32.5 30.4 29.3 30.2 Total Current Assets 168.6 165.6 183.6 186.7 Net Property, Plant & Equipment 242.4 244.4 304.6 345.6 Goodwill & Intangibles 365.1 365.1 365.1 365.1 Total Assets 776.1 775.1 853.3 897.4 Liabilities & Stockholders' Equity 2019 602.2 (289.0) 313.2 (1183) (78.5) (40.1) 76.3 (39.4) 36.9 (12.9) 24.0 53.2 $0.45 2019 91.8 84.7 36.7 213.2 350.7 365.1 929.0 Anna Dahle Ano 40 24 Ee 242.4 365.1 776.1 365.1 775.1 3044.0 365.1 853.3 345.0 365.1 897.4 350.7 365.1 929.0 19.6 6.1 25.7 503.9 529.6 246.5 776.1 16.4 5.8 22.2 503.9 526.1 249.0 775.1 21.8 7.5 29.3 577.8 607.1 246.2 853.3 25.6 8.4 34.0 604.2 638.2 259.2 897.4 31.9 10.1 42.0 604.2 646.2 282.8 929.0 2017 Net Property, Pant a Equipment Goodwill & Intangibles Total Assets Liabilities & Stockholders' Equity Accounts Payable Accrued Compensation Total Current Liabilities Long-Term Debt Total Liabilities Stockholders' Equity Total Liabilities & Stockholders' Equity Statement of Cash Flows Net Income Depreciation & Amortization Change in Accounts Receivable Change in Inventory Change in Pay. & Accrued Comp. Cash from Operations Capital Expenditures Cash from Investing Activ. Dividends Paid Sale (or Purchase) of Stock Debt Issuance (Pay Down) Cash from Financing Activ. Change in Cash Mydeco Stock Price 7.1 32.5 0.3 2019 24.0 40.1 (8.5) 1.1 (6.5) 2015 19.1 27.5 3.9 (2.9) 2.1 49.7 (24.4) (24.4) (4.9) 2016 1.5 27.4 19.0 2.1 (3.5) 46.5 (23.5) (23.5) (4.9) 2018 13.5 38.4 (7.7) (0.9) 4.7 48.0 (75.0) (75.0) (4.9) 7.1 48.1 (977) (977) (4.9) 8.0 57.1 (38.1) (38.1) (7.5) (4.9) 20.4 $8.88 (4.9) 18.1 $2.34 73.9 69.0 19.4 $5.27 26.4 21.5 (5.5) $8.78 (7.5) 11.5 $9.47
Step by Step Solution
There are 3 Steps involved in it

Get step-by-step solutions from verified subject matter experts