

Question: See the example Excel le. The weekly portfolio variance in this case is 0.149% , the standard deviation is 3.363%, and the expected return is

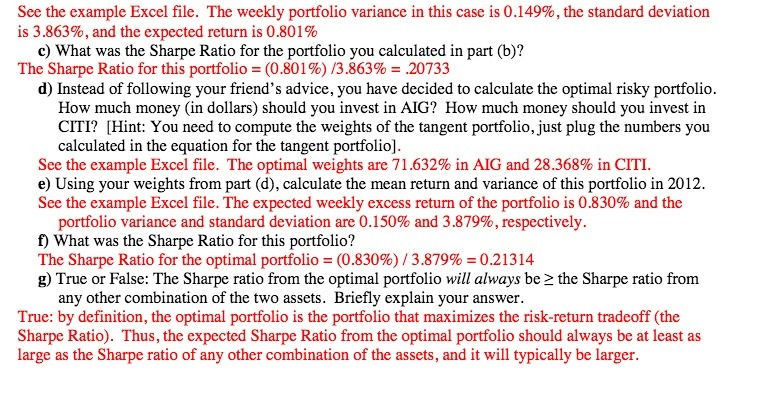
See the example Excel le. The weekly portfolio variance in this case is 0.149% , the standard deviation is 3.363%, and the expected return is 0.301% c) What was the Sharpe Ratio for the portfolio you calculated in part (b)? The Shape Ratio for this portfolio = (0.301%) 0.363% = 201133 11) Instead of following your 'ieud's advice, you have decided to calculate the optimal risky porolio. How Hatch money (in dollars} should you invest in MG? How much money should you invest in CIT]? [Hint: You need to compute the weights of the tangent portfolio.just plug the numbers you calculated in the equation for the tangent portfolio}. See the example Excel le. The optimal weights are 31.632% in MG and 23.363% in CITI. e) Using your weights from part (d), calculate the mean return and variance of this portfolio in 2012. See the example Excel file. The expected weekly excess return of the portfolio is 0.330% and the portfolio variance and standard deviation are 0.150% and 3.3T9%, respectively. 1] What was the Sharpe Ratio for this portfolio? The Sharpe Ratio for the optimal portfolio = (0.330%) t 3.339% = 0.21314 g) True or False: The Sharpe ratio from the optimal portfolio will always be 3: the Sharpe ratio from any other combination of the two assets. Briey explain your answer. True: by denition, the optimal portfolio is the portfolio that maximizes the risk-return tradeoff {the Sharpe Ratio). Thus, the expected Sharpe Ratio from the optimal portfolio should always be at least as large as the Sharpe ratio of any other combination of the assets, and it will typically be larger
Step by Step Solution
There are 3 Steps involved in it

Get step-by-step solutions from verified subject matter experts