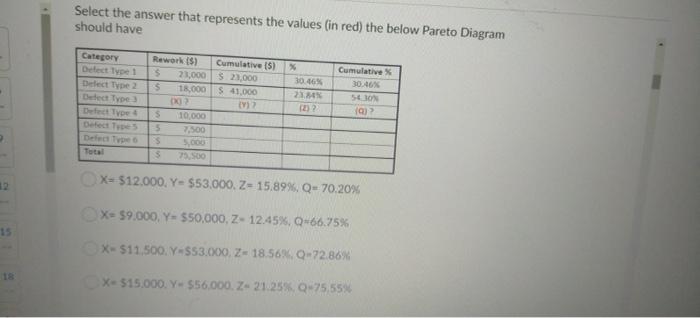
Question: Select the answer that represents the values (in red) the below Pareto Diagram should have Category DetectType1 Delect Type 2 Detect Type Defect Types Detecte

Select the answer that represents the values (in
Select the answer that represents the values (in red) the below Pareto Diagram should have Category DetectType1 Delect Type 2 Detect Type Defect Types Detecte Defeat Type % 30.46% 21 Rework (5) Cumulative (5) $ 21,000 $20,000 5 18.000 41.000 X2 (V) S 10.000 5 7,500 5.000 5 79.500 Cumulative 30.46% 54 10 X= $12,000. Y= $53,000. Z= 15.89%. Q- 70,20% 2 X= $9.000, Y- $50,000, Z-12.45%. Q-66.75% 15 X-$11,500.Y-S53.000, Z-18.56% Q-72.86% X-515.000.- 556.000.-21.255.0-75,55%

Step by Step Solution

There are 3 Steps involved in it

1 Expert Approved Answer
Step: 1 Unlock blur-text-image
Question Has Been Solved by an Expert!

Get step-by-step solutions from verified subject matter experts

Step: 2 Unlock
Step: 3 Unlock

Students Have Also Explored These Related General Management Questions!