

Question: select the correct histogram for the above data. b. describe the shape of the histogram -the distribution is skewed to the left -the distribution is
select the correct histogram for the above data. b. describe the shape of the histogram -the distribution is skewed to the left -the distribution is skewed to the right -the distribution is symmetric c. identify any unusual values unusual values ________million _________million
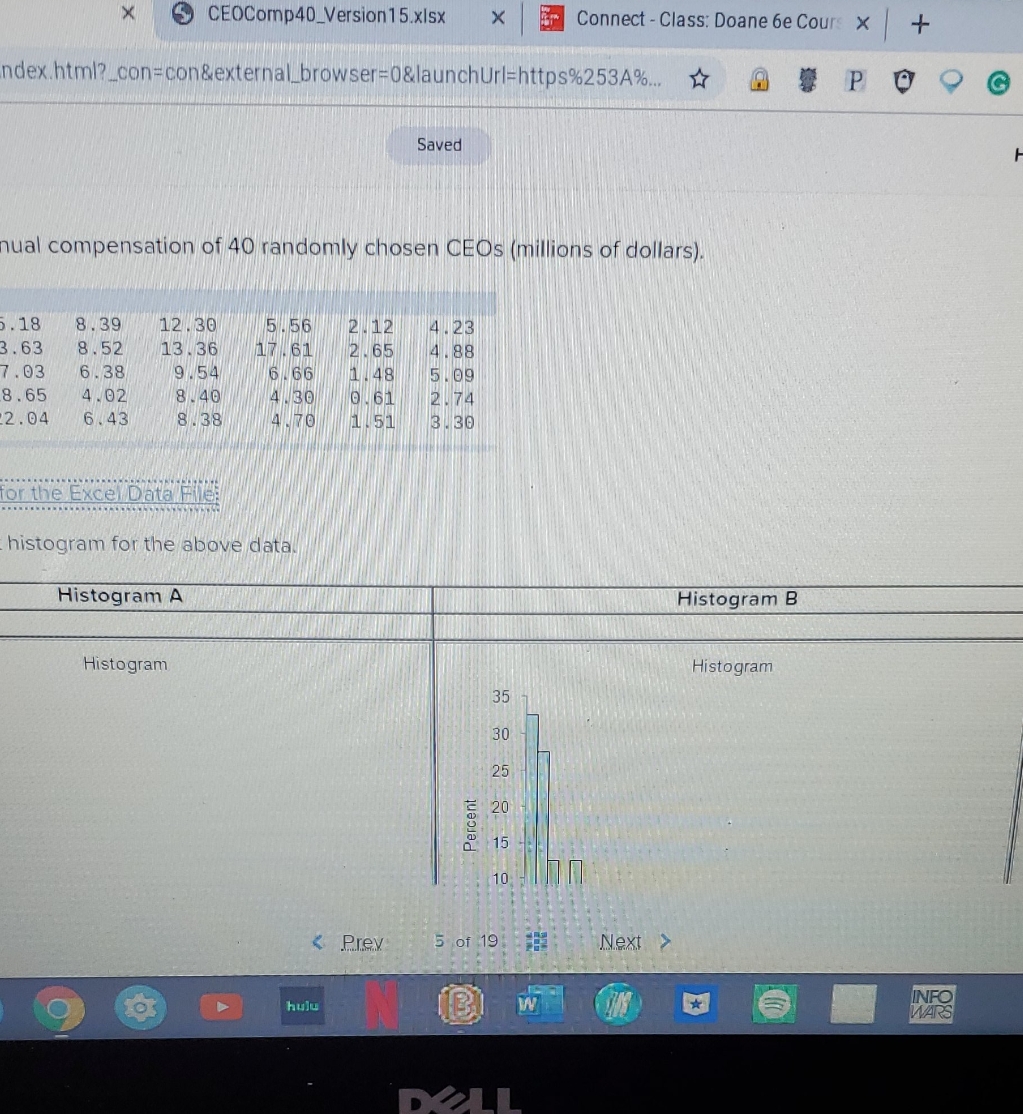
X CEOComp40_Version 15.xIsx X Connect - Class: Doane be Cours X + ndex.html?_con=con&external_browser=0&launchUrl=https%253A%... > Saved qual compensation of 40 randomly chosen CEOs (millions of dollars). . 18 8. 39 12 . 30 5.56 8. 52 13.36 2. 12 14 . 23 3. 63 17. 61 2. 65 4 . 88 7.03 6. 38 9. 54 6. 66 1. 48 5. 09 8. 65 4 .02 8 /40 4.30 0 61 8 . 38 2.74 2. 04 6. 43 4 . 76 1. 51 3. 30 for the Excel Data Files histogram for the above data Histogram A Histogram B Histogram Histogram 35 30 25 20 15 hulu N B W INFO WARS
Step by Step Solution
There are 3 Steps involved in it

Get step-by-step solutions from verified subject matter experts