

Question: Select the correct histogram from the above data: 2. Describe the Shape of the histogram: a. skewed to the left b. skewed to the right
- Select the correct histogram from the above data:
2. Describe the Shape of the histogram:
a. skewed to the left
b. skewed to the right
c. distribution is symmetric
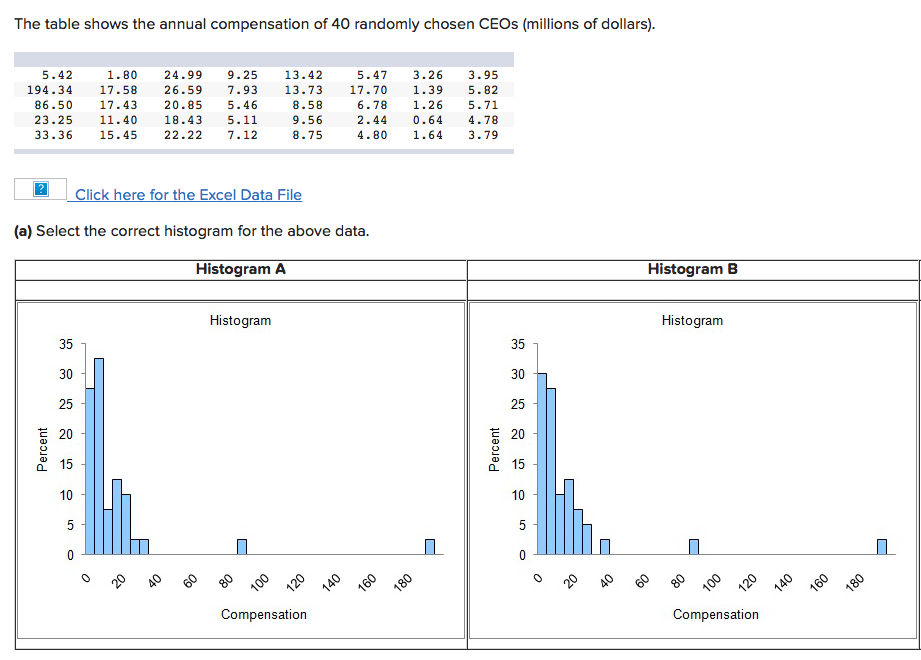
The table shows the annual compensation of 40 randomly chosen CEOs (millions of dollars). 5 . 42 1. 80 24.99 9 . 25 13.42 5. 47 3.26 3.95 194.34 17.58 26.59 7.93 13.73 17. 70 1.39 5. 82 86.50 17.43 20.85 5.46 8.58 6.78 1.26 5. 71 23.25 11 . 40 18.43 5. 11 9.56 2. 44 0.64 4.78 33.36 15 .45 22.22 7. 12 8. 75 4. 80 1.64 3.79 Click here for the Excel Data File (a) Select the correct histogram for the above data. Histogram A Histogram B Histogram Histogram 35 35 30 25 25 20 20 Percent Percent 15 15 10 O 140 460 180 100 140 160 180 Compensation Compensation
Step by Step Solution
There are 3 Steps involved in it

Get step-by-step solutions from verified subject matter experts