

Question: Select the graph that depicting fixed costs, variable costs, and total costs for each event versus the number of guests. (Enlarge each graph before
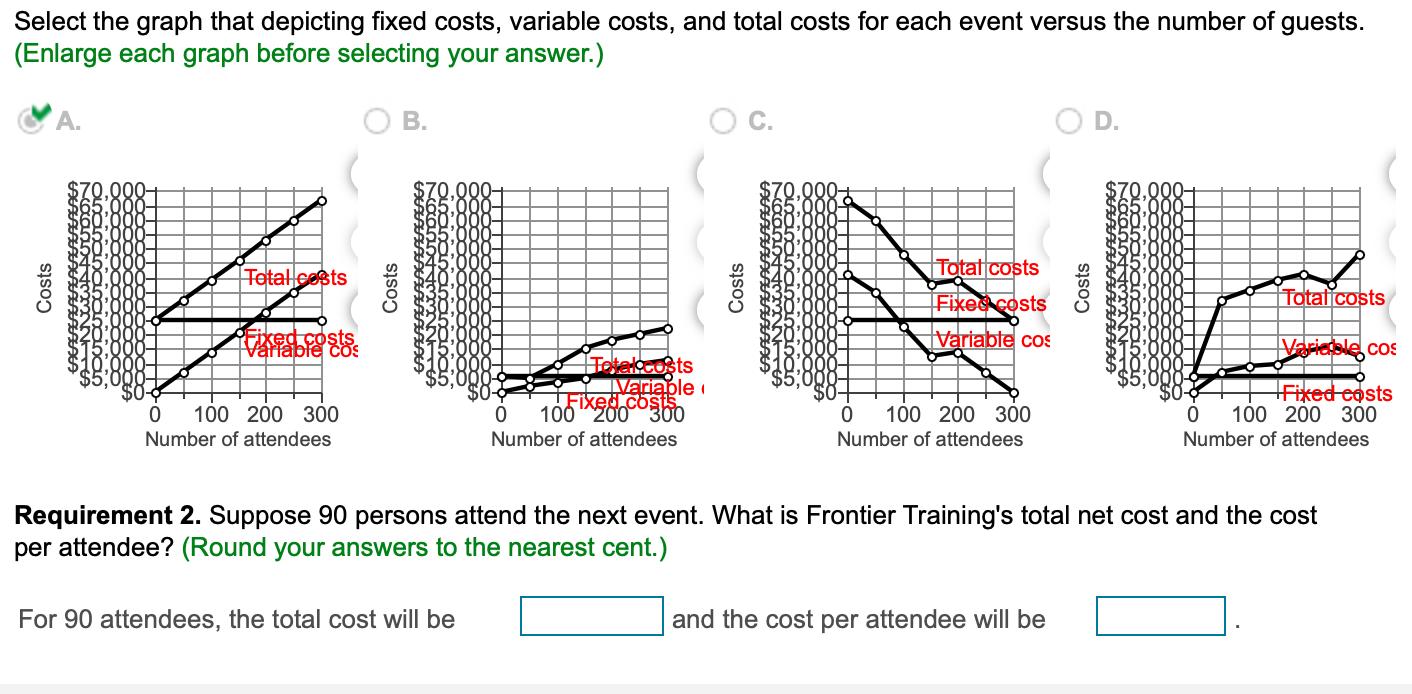
Select the graph that depicting fixed costs, variable costs, and total costs for each event versus the number of guests. (Enlarge each graph before selecting your answer.) Costs Total costs xed costs 0 100 200 300 Number of attendees Costs B. Total costs Variable Fixed costs 100 200 300 Number of attendees 0 For 90 attendees, the total cost will be Costs Total costs Fixed costs Variable cos 0 100 200 300 Number of attendees Costs and the cost per attendee will be 60080 Total costs Requirement 2. Suppose 90 persons attend the next event. What is Frontier Training's total net cost and the cost per attendee? (Round your answers to the nearest cent.) Variedale cos Fixed costs 0 100 200 300 Number of attendees
Step by Step Solution
There are 3 Steps involved in it
The correct graph is A It shows fixed costs as a horizontal line variable costs as a diagonal line i... View full answer

Get step-by-step solutions from verified subject matter experts