

Question: Selected comparative financial statement data for DFRT inc. Balance Sheet (En milliers de dollars) 2017 2018 Assets 8 346 70456 124589 759 10 256 76
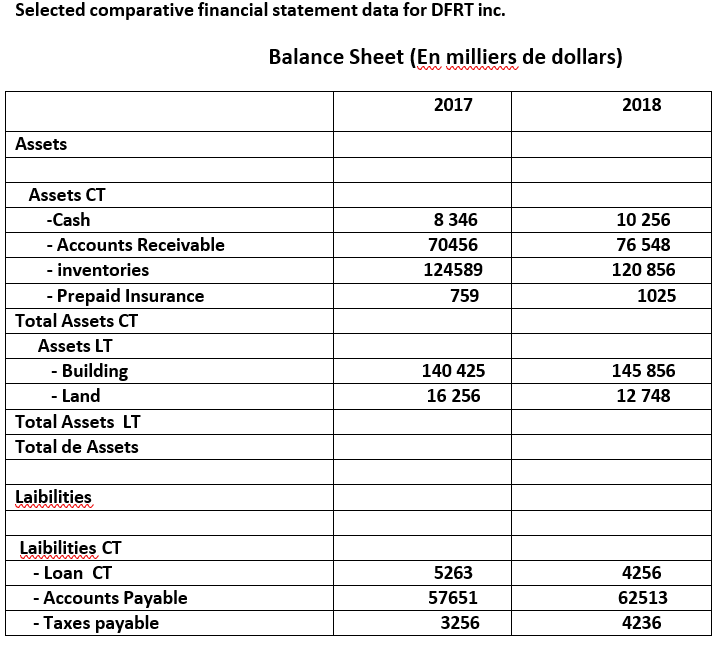
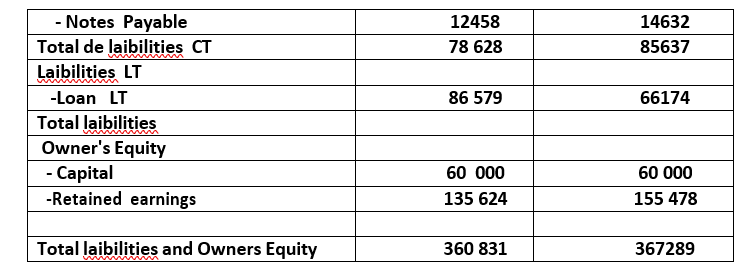
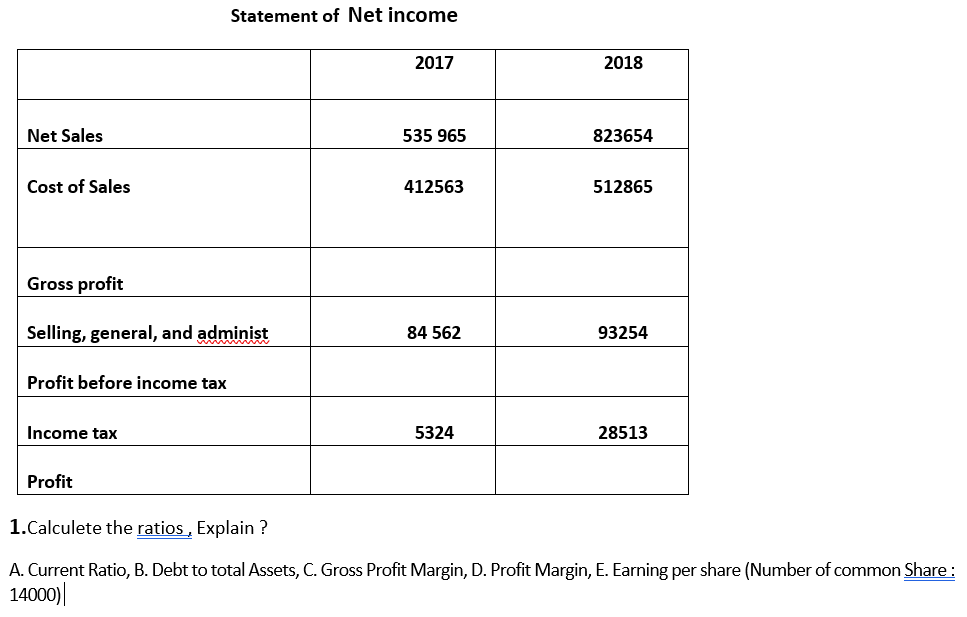
Selected comparative financial statement data for DFRT inc. Balance Sheet (En milliers de dollars) 2017 2018 Assets 8 346 70456 124589 759 10 256 76 548 120 856 1025 Assets CT -Cash - Accounts Receivable - inventories - Prepaid Insurance Total Assets CT Assets LT - Building - Land Total Assets LT Total de Assets - 140 425 16 256 145 856 12 748 Laibilities Laibilities CT - Loan CT - Accounts Payable - Taxes payable 5263 57651 3256 4256 62513 4236 12458 78 628 14632 85637 86 579 66174 - Notes Payable Total de laibilities CT Laibilities LT -Loan LT Total laibilities Owner's Equity - Capital -Retained earnings 60 000 135 624 60 000 155 478 Total laibilities and Owners Equity 360 831 367289 Statement of Net income 2017 2018 Net Sales 535 965 823654 Cost of Sales 412563 512865 Gross profit Selling, general, and administ 84 562 93254 Profit before income tax Income tax 5324 28513 Profit 1.Calculete the ratios , Explain ? A. Current Ratio, B. Debt to total Assets, C. Gross Profit Margin, D. Profit Margin, E. Earning per share (Number of common Share: 14000)
Step by Step Solution
There are 3 Steps involved in it

Get step-by-step solutions from verified subject matter experts