

Question: Selected comparative statement data for Queen Products Company are presented below. All balance sheet data are as of December 31. ? m' WileyPLUS x u
Selected comparative statement data for Queen Products Company are presented below. All balance sheet data are as of December 31.
?
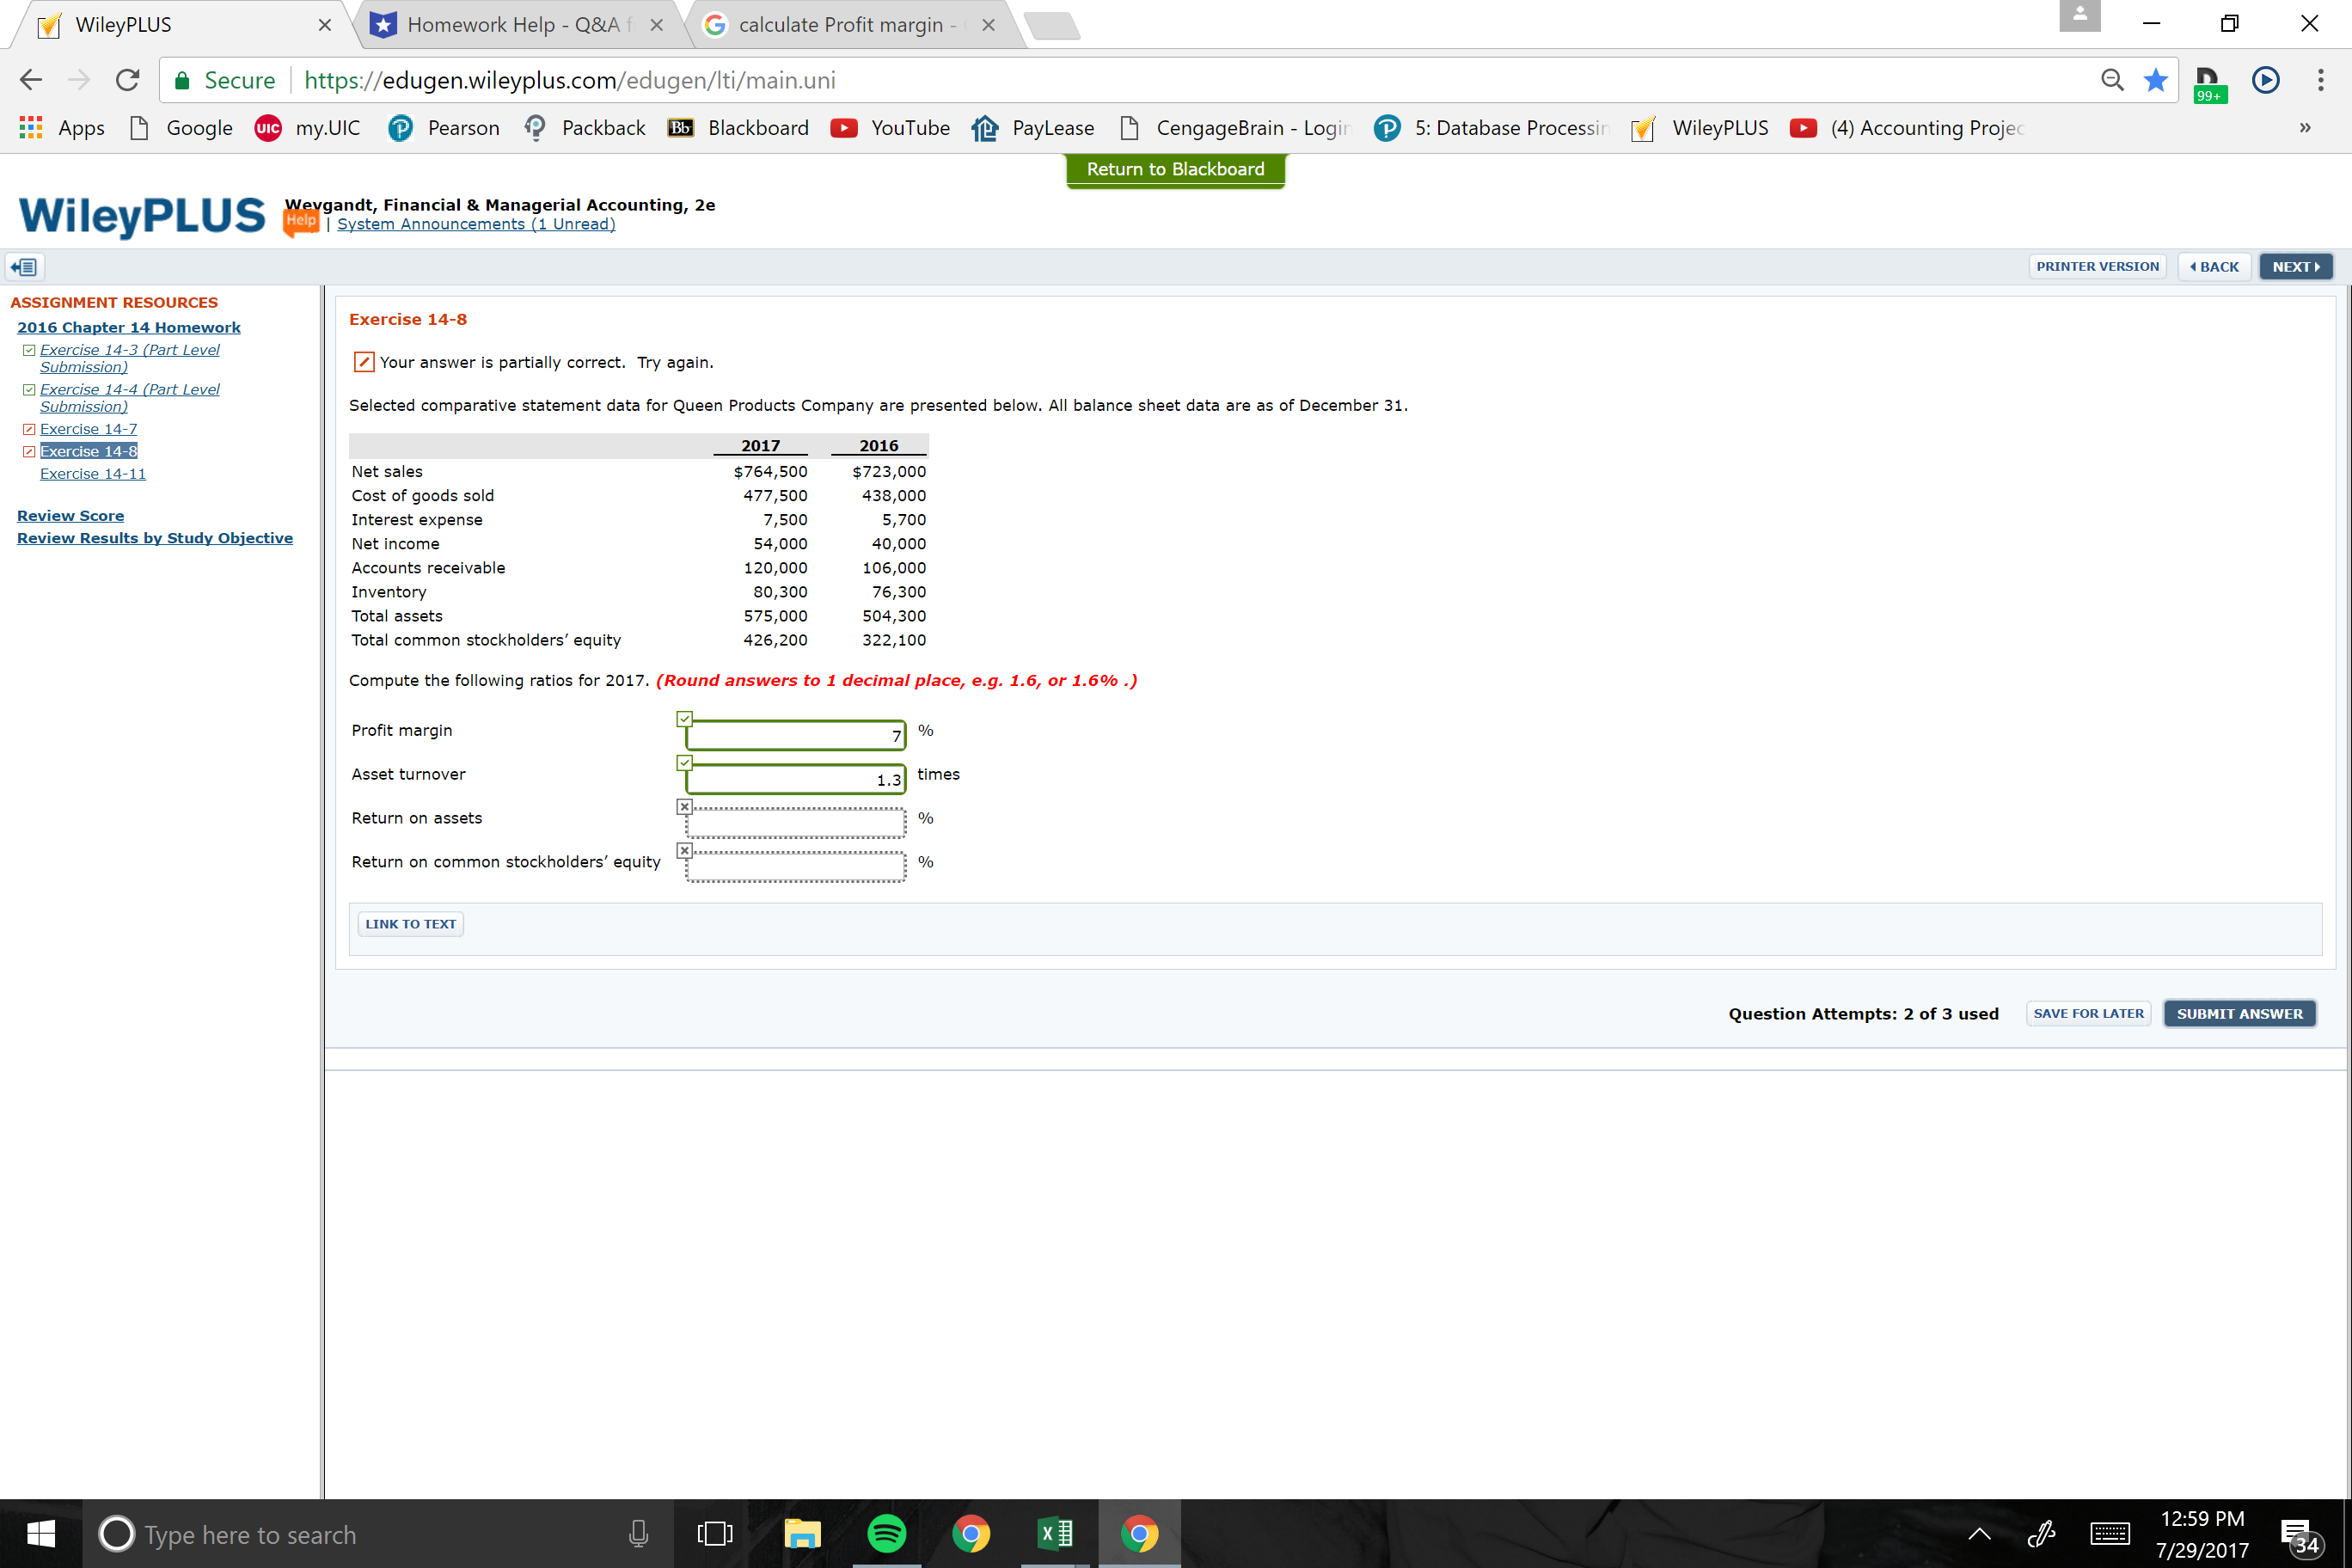
m' WileyPLUS x u Homework Help . QSLAi X 3 calculate Profit margin - X 6 C' 1 6 Secure \\ https://edugen.wi|eyplus.com/edugen/iti/mainuni Apps D Google my.UIC 0 Pearson Return to Blackboard stern Announcements 1 Unread Wi I eyPl-U s ?asndt, Financial 0 Managerial Accounting, 2e E ASSIGNMENT RESOURCES g mlglgn 513mg 14-4 (gm level ubmiisl'gn Exercise 14-8 / Vaur answer is partially correct. Try again. 5elected comparative statement data for Queen Products Company are presented below. All balance sheet data are as or Dezember 31. 1017 2016 Net sales $754,500 $723,000 Cost of goods sold 477,500 435,000 interest expense 7,500 5,700 Net income 54,000 40,000 Accounts receivable 120,000 106,000 inventory 00,300 76,300 Total assets 575,000 504,300 Total common stockholders equity 425,200 322,100 compute the following ratlos for 2017. (Round answers to 1 decimal place, 3.9. 1.5, or 1.5% .) Prot margin Asset turnover Return on assets Return on common stockholders equity LINK to rm Packback Blackboard II VouTube fly PayLease D CengageBrain-Logii @ 5: Database Process'ii M WileyPLUS u (4)Accounting Proje
Step by Step Solution
There are 3 Steps involved in it

Get step-by-step solutions from verified subject matter experts