

Question: Exercise 14-8 Selected comparative statement data for Queen Products Company are presented below. All balance sheet dat 2017 2016 Net sales Cost of goods sold
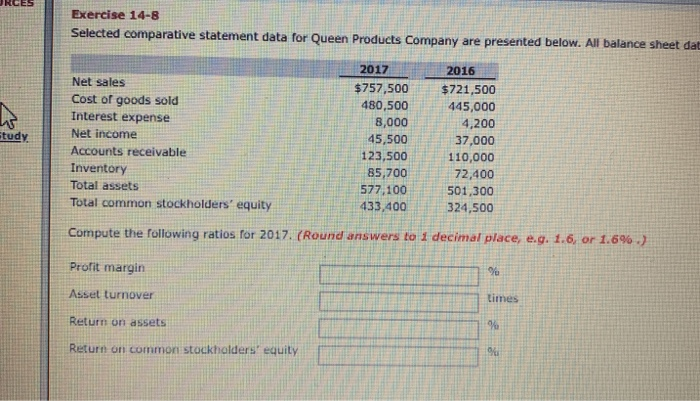
Exercise 14-8 Selected comparative statement data for Queen Products Company are presented below. All balance sheet dat 2017 2016 Net sales Cost of goods sold Interest expense Net income Accounts receivable Inventory Total assets Total common stockholders' equity $757,500$721,500 445,000 4,200 37,000 110,000 72,400 577,100 501,300 433,400324,500 480,500 8,000 45,500 123,500 85,700 tudy Compute the rollowing ratios for 2017, (Round answers to 1 decimal place, eg. 1.6, or 1.6% .) Profit margin Asset turnover Return on assets Return on common stockholders equity times
Step by Step Solution
There are 3 Steps involved in it
1 Expert Approved Answer
Step: 1 Unlock

Question Has Been Solved by an Expert!
Get step-by-step solutions from verified subject matter experts
Step: 2 Unlock
Step: 3 Unlock