

Question: Separate the column headers and data (hint: use the Data Interpreter tool). Shape your data into the following format (hint: use the Pivot tool). Split
- Separate the column headers and data (hint: use the Data Interpreter tool).
- Shape your data into the following format (hint: use the Pivot tool).
- Split the Employee field into two parts. For the first row, “B” is the location information, and “002” is the Employee ID number.
- Visualize the data to show the efficiency of the employees according to the number of resolved incidents
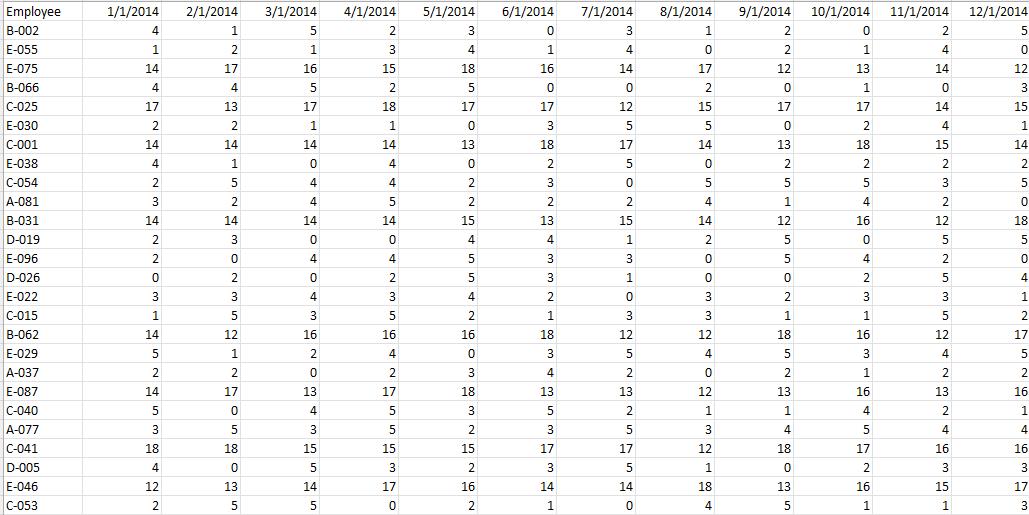
Employee B-002 E-055 1/1/2014 2/1/2014 3/1/2014 4/1/2014 5/1/2014 6/1/2014 7/1/2014 8/1/2014 9/1/2014 10/1/2014 11/1/2014 12/1/2014 4 1 3 3 1 2 5 2 1 3 4 1 4 2 1 4 E-075 14 17 16 15 18 16 14 17 12 13 14 12 B-066 4 4 5 2 2. 3 C-025 17 13 17 18 17 17 12 15 17 17 14 15 E-030 2 1 3 5 5 2 4 1 C-001 14 14 14 14 13 18 17 14 13 18 15 14 E-038 4 4 2 5 2 2 2 C-054 2 4 4 2 3 3 5 A-081 3 2 4 2 2 2 4 4 2 -031 14 14 14 14 15 13 15 14 12 16 12 18 D-019 2 3 4 4 1 2 5 E-096 2 4 4 3 3 4 2 D-026 2 2 5 3 1 4 E-022 3 4 3 4 2 3 2. 3 3 1 C-015 5 3 5 2 3 3 1 B-062 14 12 16 16 16 18 12 12 18 16 12 17 E-029 5 1. 2. 4 3 4 3 4 5 A-037 2. 2 2 3 4 2 2 1 2 2 E-087 14 17 13 17 18 13 13 12 13 16 13 16 C-040 4 3 5 2 1 4 2 1 A-077 3 5 3 5 2 3 5 4 4 4 C-041 18 18 15 15 15 17 17 12 18 17 16 16 D-005 4 3 2 5 1 2 3 3 E-046 12 13 14 17 16 14 14 18 13 16 15 17 C-053 2 5 5 2 1 4 5 1 3
Step by Step Solution
3.45 Rating (158 Votes )
There are 3 Steps involved in it
Step 1 Store the given data into an Excel file Employeexlsx A sample of the given dataset 1 Step 2 L... View full answer

Get step-by-step solutions from verified subject matter experts