

Question: Set the proper scale and plot the coordinates from the table Label x intercepts 2 1 0 1 2 11 Part 2 Graph two functions

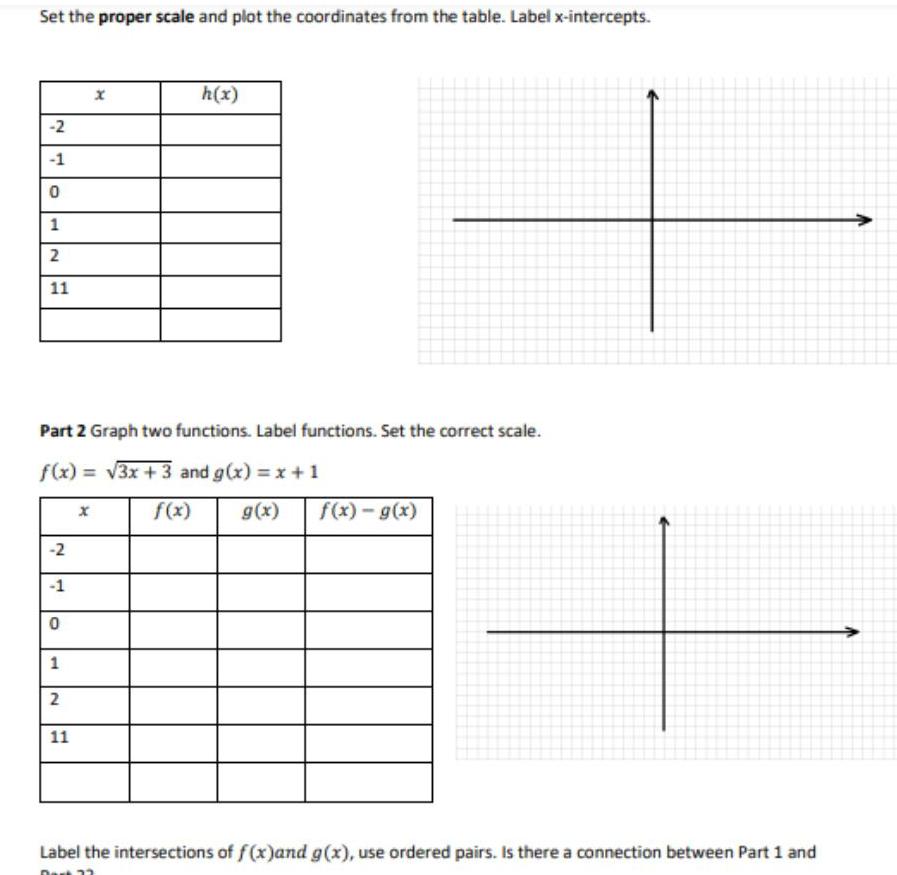
Set the proper scale and plot the coordinates from the table Label x intercepts 2 1 0 1 2 11 Part 2 Graph two functions Label functions Set the correct scale f x 3x 3 and g x x 1 2 1 0 1 2 h x 11 f x g x f x g x Label the intersections of f x and g x use ordered pairs Is there a connection between Part 1 and Da 37
Step by Step Solution
There are 3 Steps involved in it
1 Expert Approved Answer
Step: 1 Unlock

Question Has Been Solved by an Expert!
Get step-by-step solutions from verified subject matter experts
Step: 2 Unlock
Step: 3 Unlock