

Question: Set4LinearApplication: Problem 2 Previous Problem List Next (1 point) The table below shows the IQ of ten students and the number of hours of
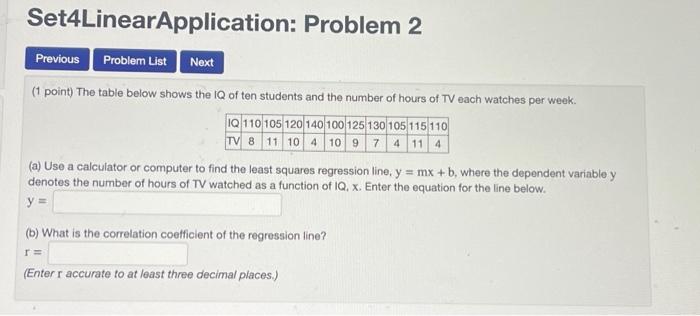
Set4LinearApplication: Problem 2 Previous Problem List Next (1 point) The table below shows the IQ of ten students and the number of hours of TV each watches per week. IQ 110 105 120 140 100 125 130 105 115 110 TV 8 11 10 4 10 9 7 4 11 4 (a) Use a calculator or computer to find the least squares regression line, y = mx + b, where the dependent variable y denotes the number of hours of TV watched as a function of IQ. x. Enter the equation for the line below. y= (b) What is the correlation coefficient of the regression line? r = (Enter r accurate to at least three decimal places.)
Step by Step Solution
There are 3 Steps involved in it
1 Expert Approved Answer
Step: 1 Unlock

Question Has Been Solved by an Expert!
Get step-by-step solutions from verified subject matter experts
Step: 2 Unlock
Step: 3 Unlock