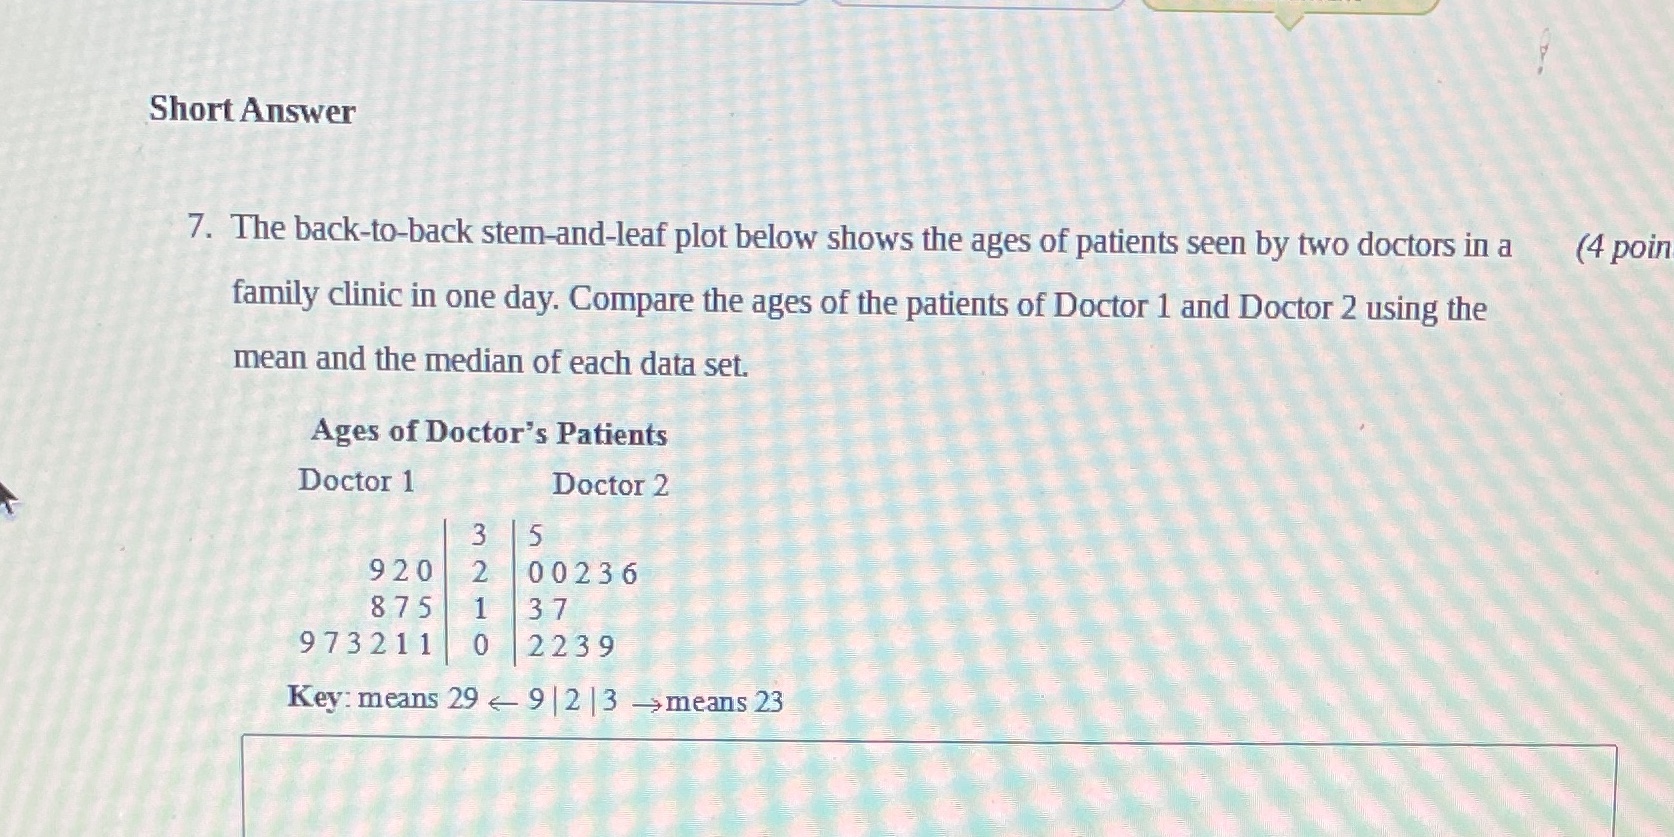
Question: Short Answer 7. The back-to-back stem-and-leaf plot below shows the ages of patients seen by two doctors in a (4 poin family clinic in one

Short Answer 7. The back-to-back stem-and-leaf
Short Answer 7. The back-to-back stem-and-leaf plot below shows the ages of patients seen by two doctors in a (4 poin family clinic in one day. Compare the ages of the patients of Doctor 1 and Doctor 2 using the mean and the median of each data set. Ages of Doctor's Patients Doctor 1 Doctor 2 3 5 920 2 00236 875 1 37 973211 0 2239 Key: means 29 9 |2 13 - means 23

Step by Step Solution

There are 3 Steps involved in it

1 Expert Approved Answer
Step: 1 Unlock blur-text-image
Question Has Been Solved by an Expert!

Get step-by-step solutions from verified subject matter experts

Step: 2 Unlock
Step: 3 Unlock

Students Have Also Explored These Related Mathematics Questions!