Question: show all steps please 4. (14 points) Consider a multiple linear regression model to study the relationship between miles per gallon (mpg) as the response

show all steps please show all steps please 4. (14 points) Consider a
show all steps please 4. (14 points) Consider a
4. (14 points) Consider a multiple linear regression model to study the relationship between miles per gallon (mpg) as the response variable and covariates: displacement (11), gross horsepower (22), weight (x3), and 1/4 mile time (34). a) (4 points) Fitting the untransformed model produces the top residual versus fitted value plot in Figure 1. Which regression assumption(s) might you be concerned for their validity? Briefly explain. b) (3 points) The Box-Cox method yields a maximum likelihood estimate for 1 of -0.1 and a 95% confidence interval of (-0.45,0.25). State the new model using a Box-Cox transformation and define any variables you introduce. c) (4 points) Fitting the transformed model from (b) produces the bottom residual versus fitted value plot in Figure 1. What concerns might you have from studying the plot? Briefly explain. d) (3 points) Does using a Box-Cox transformation appear to yield an improvement? In one or two sentences, justify your answer. Residual by Predicted for mpg 1> 18 20 N ou O Residual O o o O o o O o . o o oo 2 o o o 4 10 15 25 30 20 Predicted Value Residual by Predicted for BoxCoxY 0.3 O 0.2 O 0.1 o o Residual o o o o 0.0 o o o 10 o o 00 O 0 O O -0.1 o o o 24 2.6 30 3.2 3.4 28 Predicted Value Figure 1: Diagnostic plots for Question 4. Top: Plot for 4(a); Bottom: Plot for 4(c). 4. (14 points) Consider a multiple linear regression model to study the relationship between miles per gallon (mpg) as the response variable and covariates: displacement (11), gross horsepower (22), weight (x3), and 1/4 mile time (34). a) (4 points) Fitting the untransformed model produces the top residual versus fitted value plot in Figure 1. Which regression assumption(s) might you be concerned for their validity? Briefly explain. b) (3 points) The Box-Cox method yields a maximum likelihood estimate for 1 of -0.1 and a 95% confidence interval of (-0.45,0.25). State the new model using a Box-Cox transformation and define any variables you introduce. c) (4 points) Fitting the transformed model from (b) produces the bottom residual versus fitted value plot in Figure 1. What concerns might you have from studying the plot? Briefly explain. d) (3 points) Does using a Box-Cox transformation appear to yield an improvement? In one or two sentences, justify your answer. Residual by Predicted for mpg 1> 18 20 N ou O Residual O o o O o o O o . o o oo 2 o o o 4 10 15 25 30 20 Predicted Value Residual by Predicted for BoxCoxY 0.3 O 0.2 O 0.1 o o Residual o o o o 0.0 o o o 10 o o 00 O 0 O O -0.1 o o o 24 2.6 30 3.2 3.4 28 Predicted Value Figure 1: Diagnostic plots for Question 4. Top: Plot for 4(a); Bottom: Plot for 4(c)

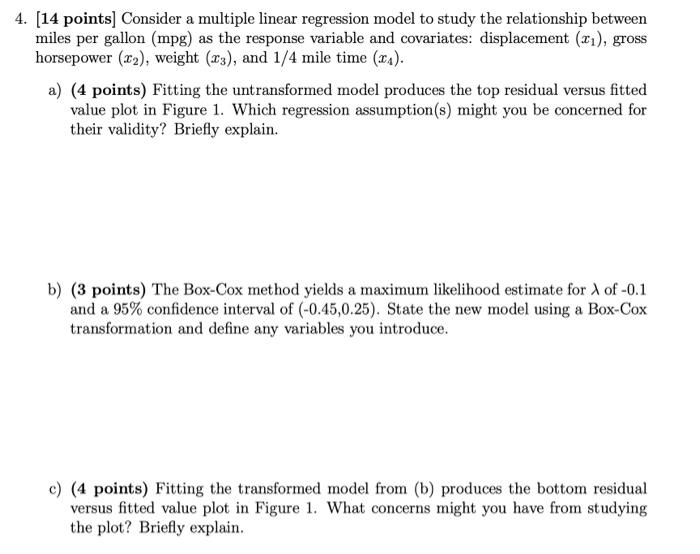
Step by Step Solution

There are 3 Steps involved in it

1 Expert Approved Answer
Step: 1 Unlock blur-text-image
Question Has Been Solved by an Expert!

Get step-by-step solutions from verified subject matter experts

Step: 2 Unlock
Step: 3 Unlock

Students Have Also Explored These Related General Management Questions!