

Question: show all work in formula in excel format 1 Scenario Analysis (Excel Scenario Manager) 2 Scenario analysis is used to determine the range of possible
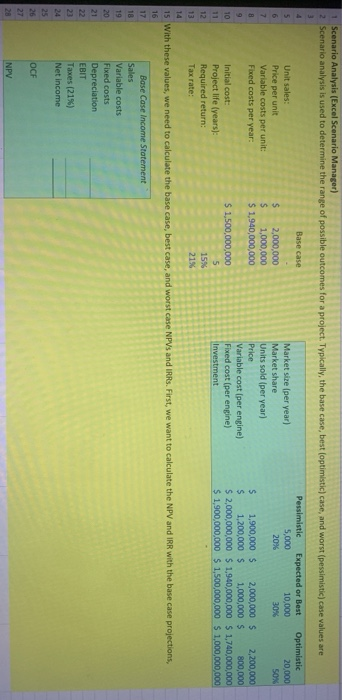
1 Scenario Analysis (Excel Scenario Manager) 2 Scenario analysis is used to determine the range of possible outcomes for a project. Typically, the base case, best optimistic) case, and worst (pessimistic) case values are 3 Base case Pessimistic Expected or Best Optimistic 5 Unit sales: Market size (per year) 5.000 10,000 20,000 6 Price per unit $ 2,000,000 Market share 20% 30% SOX 7 Variable costs per unit: $ 1,000,000 Units sold (per year) B Fixed costs per year: $ 1,940,000,000 Price s 1,900,000 $ 2,000,000 $ 2,200,000 9 Variable cost (per engine) s 1,200,000 $ 1,000,000 $ 800,000 10 Initial cost: $ 1,500,000,000 Fixed cost (per engine) $ 2,000,000,000 $ 1,940,000,000 $ 1,740,000,000 11 Project life (years): 5 Investment $ 1,900,000,000 $ 1,500,000,000 5 1,000,000,000 12 Required return; 15% 13 Tax rate: 21% 14 15 With these values, we need to calculate the base case, best case, and worst case NPVs and IRRs. First, we want to calculate the NPV and IRR with the base case projections, 16 17 Base Case Income Statement 18 Sales 19 Variable costs 20 Fixed costs 21 Depreciation EBIT 23 Taxes (21%) 24 Net income 25 26 OCF 27 28 NPV
Step by Step Solution
There are 3 Steps involved in it

Get step-by-step solutions from verified subject matter experts