

Question: show all work in formula in excel format show all work in formula in excel format just fill the green box Scenario Analysis (Auto-fil) Scenario
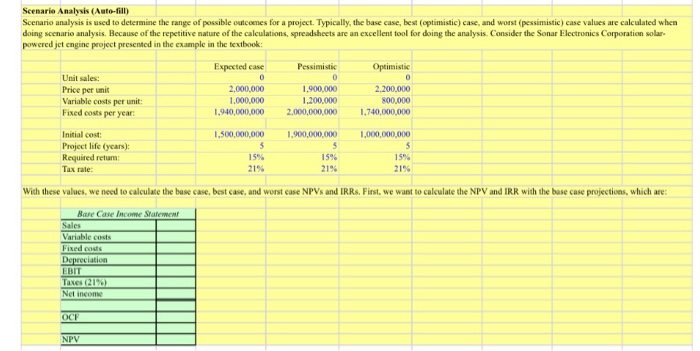
Scenario Analysis (Auto-fil) Scenario analysis is used to determine the range of possible outcomes for a project. Typically, the base case, best (optimistic) case, and worst (pessimistic) case values are calculated when doing scenario analysis. Because of the repetitive nature of the calculations, spreadsheets are an excellent tool for doing the analysis. Consider the Sonar Electronics Corporation solar powered jet engine project presented in the example in the textbook: Unit sales: Price per unit Variable costs per unit: Fixed costs per year: Expected case 0 2.000.000 1.000.000 1.940,000,000 Pessimistic 0 1.900.000 1.200.000 2,000,000,000 Optimistic 0 2,200,000 800,000 1.740,000,000 Initial cost: Project life (years): Required retum Tax rate: 1.500,000,000 5 15% 21% 1.900,000,000 5 15% 21% 1,000,000,000 5 199 21% With these values, we need to calculate the buse case, best case, and worst case NPVs and IRRs. First, we want to calculate the NPV and IRR with the base case projections, which are: Bare Case Income Statement Sales Variable costs Fixed costs Depreciation EBIT Taxes (21%) Net income OCE NPV Scenario Analysis (Auto-fill) Scenario analysis is used to determine the range of possible outcomes for a project. Typically, the base case, best (optimistic) case, and worst (pessimistic) case values are calculated when doing scenario analysis. Because of the repetitive nature of the calculations, spreadsheets are an excellent tool for doing the analysis. Consider the Sonar Electronics Corporation solar powered jet engine project presented in the example in the textbook: Unit sales: Price per unit Variable costs per unit Fixed costs per year: Expected case 0 2,000,000 1,000,000 1.940,000,000 Pessimistic ) 0 1,900,000 1.200,000 2,000,000,000 Optimistic 0 2,200,000 800,000 1,740,000,000 Initial cost Project life (years) Required retum Tax rate: 1.500,000,000 5 15% 21% 1,900,000,000 5 15% 21% 1,000,000,000 5 19% 21% With these values, we need to calculate the base case, best case, and worst ease NPVs and IRRs. First, we want to calculate the NPV and IRR with the base case projections, which are: Base Case Income Statement Sales Variable costs Fixed costs Depreciation EBIT Taxes (21%) Net income OCE NPV
Step by Step Solution
There are 3 Steps involved in it

Get step-by-step solutions from verified subject matter experts