

Question: A researcher wants to investigate the relationship between money invested in newspaper advertisement and product sales. Data have been collected and can be downloaded:
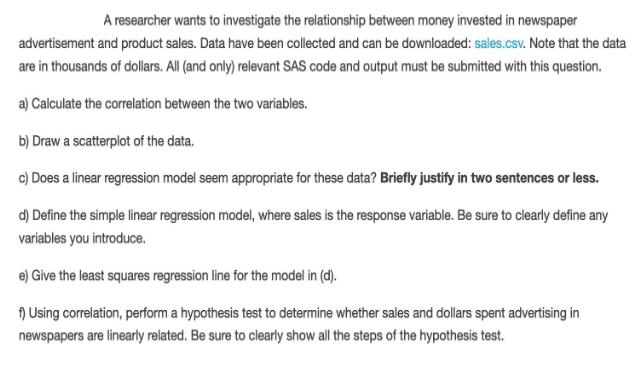
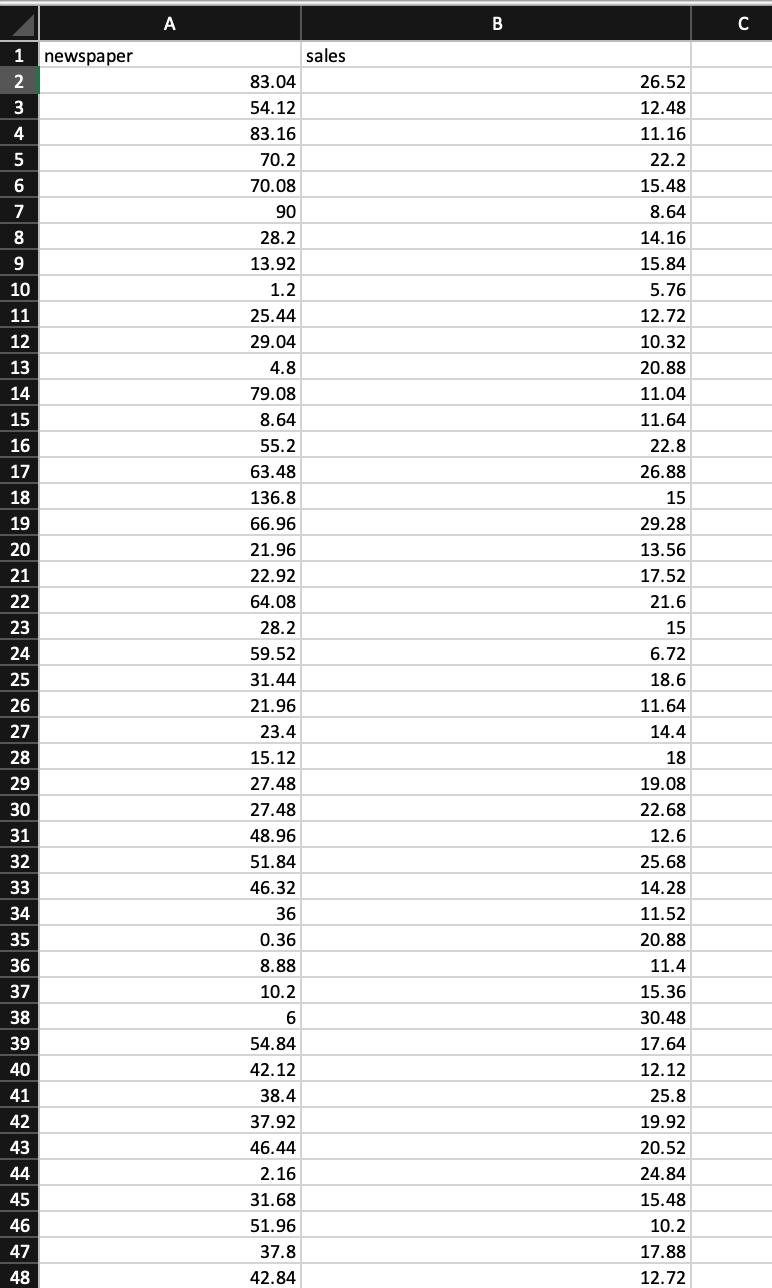
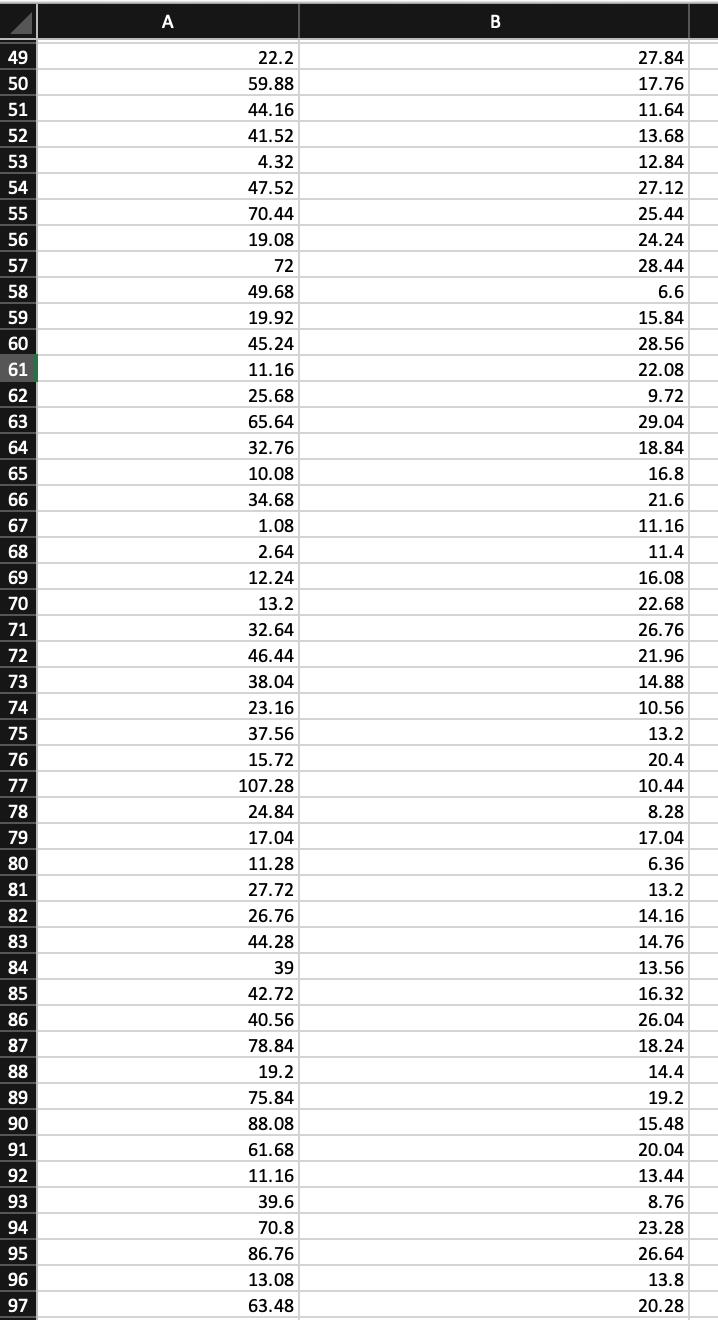
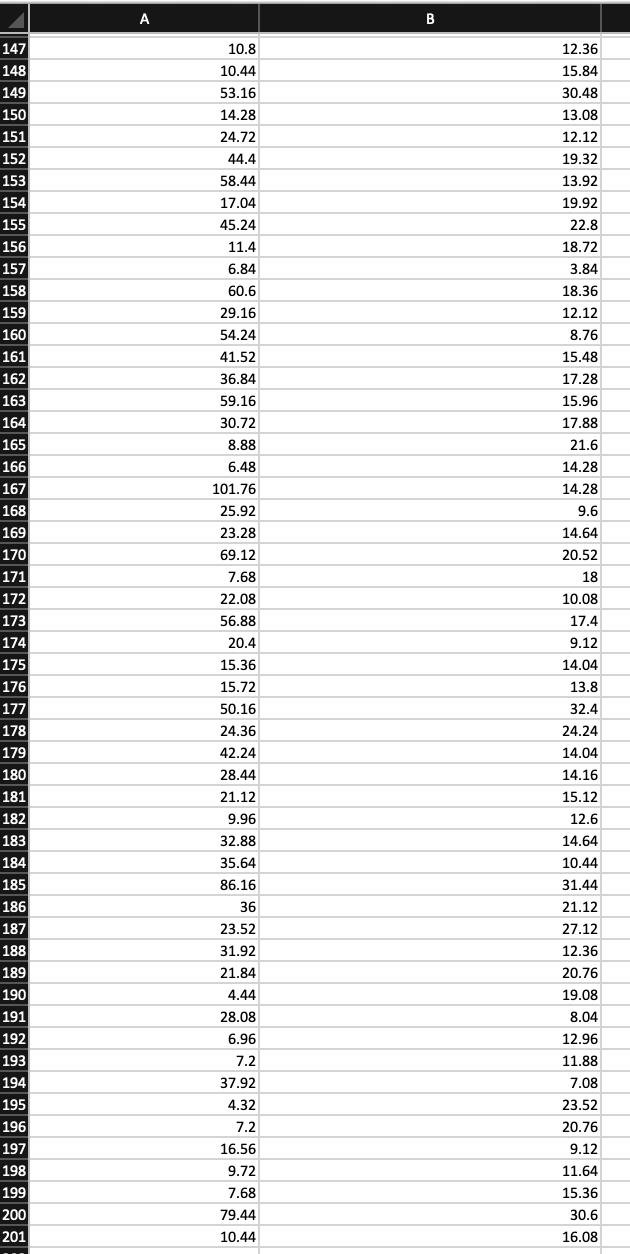
A researcher wants to investigate the relationship between money invested in newspaper advertisement and product sales. Data have been collected and can be downloaded: sales.csv. Note that the data are in thousands of dollars. All (and only) relevant SAS code and output must be submitted with this question. a) Calculate the correlation between the two variables. b) Draw a scatterplot of the data. c) Does a linear regression model seem appropriate for these data? Briefly justify in two sentences or less. d) Define the simple linear regression model, where sales is the response variable. Be sure to clearly define any variables you introduce. e) Give the least squares regression line for the model in (d). f) Using correlation, perform a hypothesis test to determine whether sales and dollars spent advertising in newspapers are linearly related. Be sure to clearly show all the steps of the hypothesis test. 1 newspaper 2 3 4 5 6 7 8 9 10 11 12 13 14 15 16 17 18 19 20 21 22 23 24 25 26 27 28 29 30 31 32 33 34 35 36 37 38 39 40 41 42 43 44 45 46 47 48 A 83.04 54.12 83.16 70.2 70.08 90 28.2 13.92 1.2 25.44 29.04 4.8 79.08 8.64 55.2 63.48 136.8 66.96 21.96 22.92 64.08 28.2 59.52 31.44 21.96 23.4 15.12 27.48 27.48 48.96 51.84 46.32 36 0.36 8.88 10.2 6 54.84 42.12 38.4 37.92 46.44 2.16 31.68 51.96 37.8 42.84 sales B 26.52 12.48 11.16 22.2 15.48 8.64 14.16 15.84 5.76 12.72 10.32 20.88 11.04 11.64 22.8 26.88 15 29.28 13.56 17.52 21.6 15 6.72 18.6 11.64 14.4 18 19.08 22.68 12.6 25.68 14.28 11.52 20.88 11.4 15.36 30.48 17.64 12.12 25.8 19.92 20.52 24.84 15.48 10.2 17.88 12.72 C 49 50 51 52 53 54 55 56 57 58 59 60 61 62 63 64 65 66 67 68 69 70 71 72 73 74 75 76 77 78 79 80 81 82 83 84 85 86 87 88 89 90 91 92 93 94 95 96 97 A 22.2 59.88 44.16 41.52 4.32 47.52 70.44 19.08 72 49.68 19.92 45.24 11.16 25.68 65.64 32.76 10.08 34.68 1.08 2.64 12.24 13.2 32.64 46.44 38.04 23.16 37.56 15.72 107.28 24.84 17.04 11.28 27.72 26.76 44.28 39 42.72 40.56 78.84 19.2 75.84 88.08 61.68 11.16 39.6 70.8 86.76 13.08 63.48 B 27.84 17.76 11.64 13.68 12.84 27.12 25.44 24.24 28.44 6.6 15.84 28.56 22.08 9.72 29.04 18.84 16.8 21.6 11.16 11.4 16.08 22.68 26.76 21.96 14.88 10.56 13.2 20.4 10.44 8.28 17.04 6.36 13.2 14.16 14.76 13.56 16.32 26.04 18.24 14.4 19.2 15.48 20.04 13.44 8.76 23.28 26.64 13.8 20.28 98 99 100 101 102 103 104 105 106 107 108 109 110 111 112 113 114 115 116 117 118 119 120 121 122 123 124 125 126 127 128 129 130 131 132 133 134 135 136 137 138 139 140 141 142 143 144 145 146 A 7.08 26.4 61.44 55.08 59.76 121.08 25.68 21.48 6.36 70.8 35.64 27.84 30.72 6.6 67.8 27.84 2.88 12.84 41.4 63.24 30.72 17.76 95.04 26.76 55.44 60.48 18.72 14.88 89.04 31.08 60.72 11.04 3.84 51.72 10.44 51.6 2.52 54.12 78.72 10.2 11.16 71.64 24.6 2.04 15.48 90.72 45.48 41.28 46.68 B 14.04 18.6 30.48 20.64 14.04 28.56 17.76 17.64 24.84 23.04 8.64 10.44 6.36 23.76 16.08 26.16 16.92 19.08 17.52 15.12 14.64 11.28 19.08 7.92 18.6 8.4 13.92 18.24 23.64 12.72 7.92 10.56 29.64 11.64 1.92 15.24 6.84 23.52 12.96 13.92 11.4 24.96 11.52 24.84 13.08 23.04 24.12 12.48 13.68 147 148 149 150 151 152 153 154 155 156 157 158 159 160 161 162 163 164 165 166 167 168 169 170 171 172 173 174 175 176 177 178 179 180 181 182 183 184 185 186 187 188 189 190 191 192 193 194 195 196 197 198 199 200 201 --- A 10.8 10.44 53.16 14.28 24.72 44.4 58.44 17.04 45.24 11.4 6.84 60.6 29.16 54.24 41.52 36.84 59.16 30.72 8.88 6.48 101.76 25.92 23.28 69.12 7.68 22.08 56.88 20.4 15.36 15.72 50.16 24.36 42.24 28.44 21.12 9.96 32.88 35.64 86.16 36 23.52 31.92 21.84 4.44 28.08 6.96 7.2 37.92 4.32 7.2 16.56 9.72 7.68 79.44 10.44 B 12.36 15.84 30.48 13.08 12.12 19.32 13.92 19.92 22.8 18.72 3.84 18.36 12.12 8.76 15.48 17.28 15.96 17.88 21.6 14.28 14.28 9.6 14.64 20.52 18 10.08 17.4 9.12 14.04 13.8 32.4 24.24 14.04 14.16 15.12 12.6 14.64 10.44 31.44 21.12 27.12 12.36 20.76 19.08 8.04 12.96 11.88 7.08 23.52 20.76 9.12 11.64 15.36 30.6 16.08
Step by Step Solution
3.47 Rating (150 Votes )
There are 3 Steps involved in it
Sol note here I cannot type all 200 values Giving explanation First create a data set product with data step create a dataset proc sgplot we get scatt... View full answer

Get step-by-step solutions from verified subject matter experts