

Question: Show excel formulas used. Enter a SUMIFS function in cell C10 on the Summary worksheet. The purpose of the function is to sum the values
Show excel formulas used.
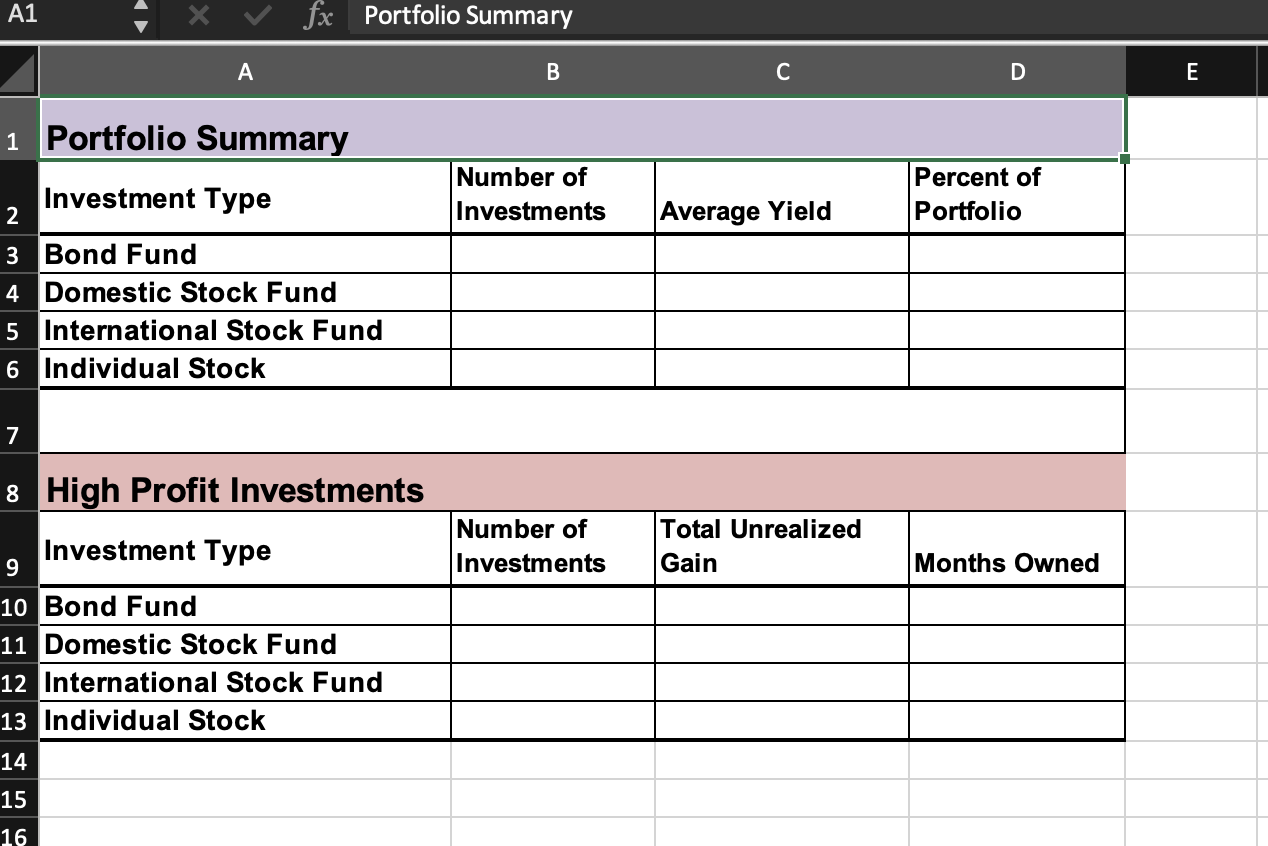
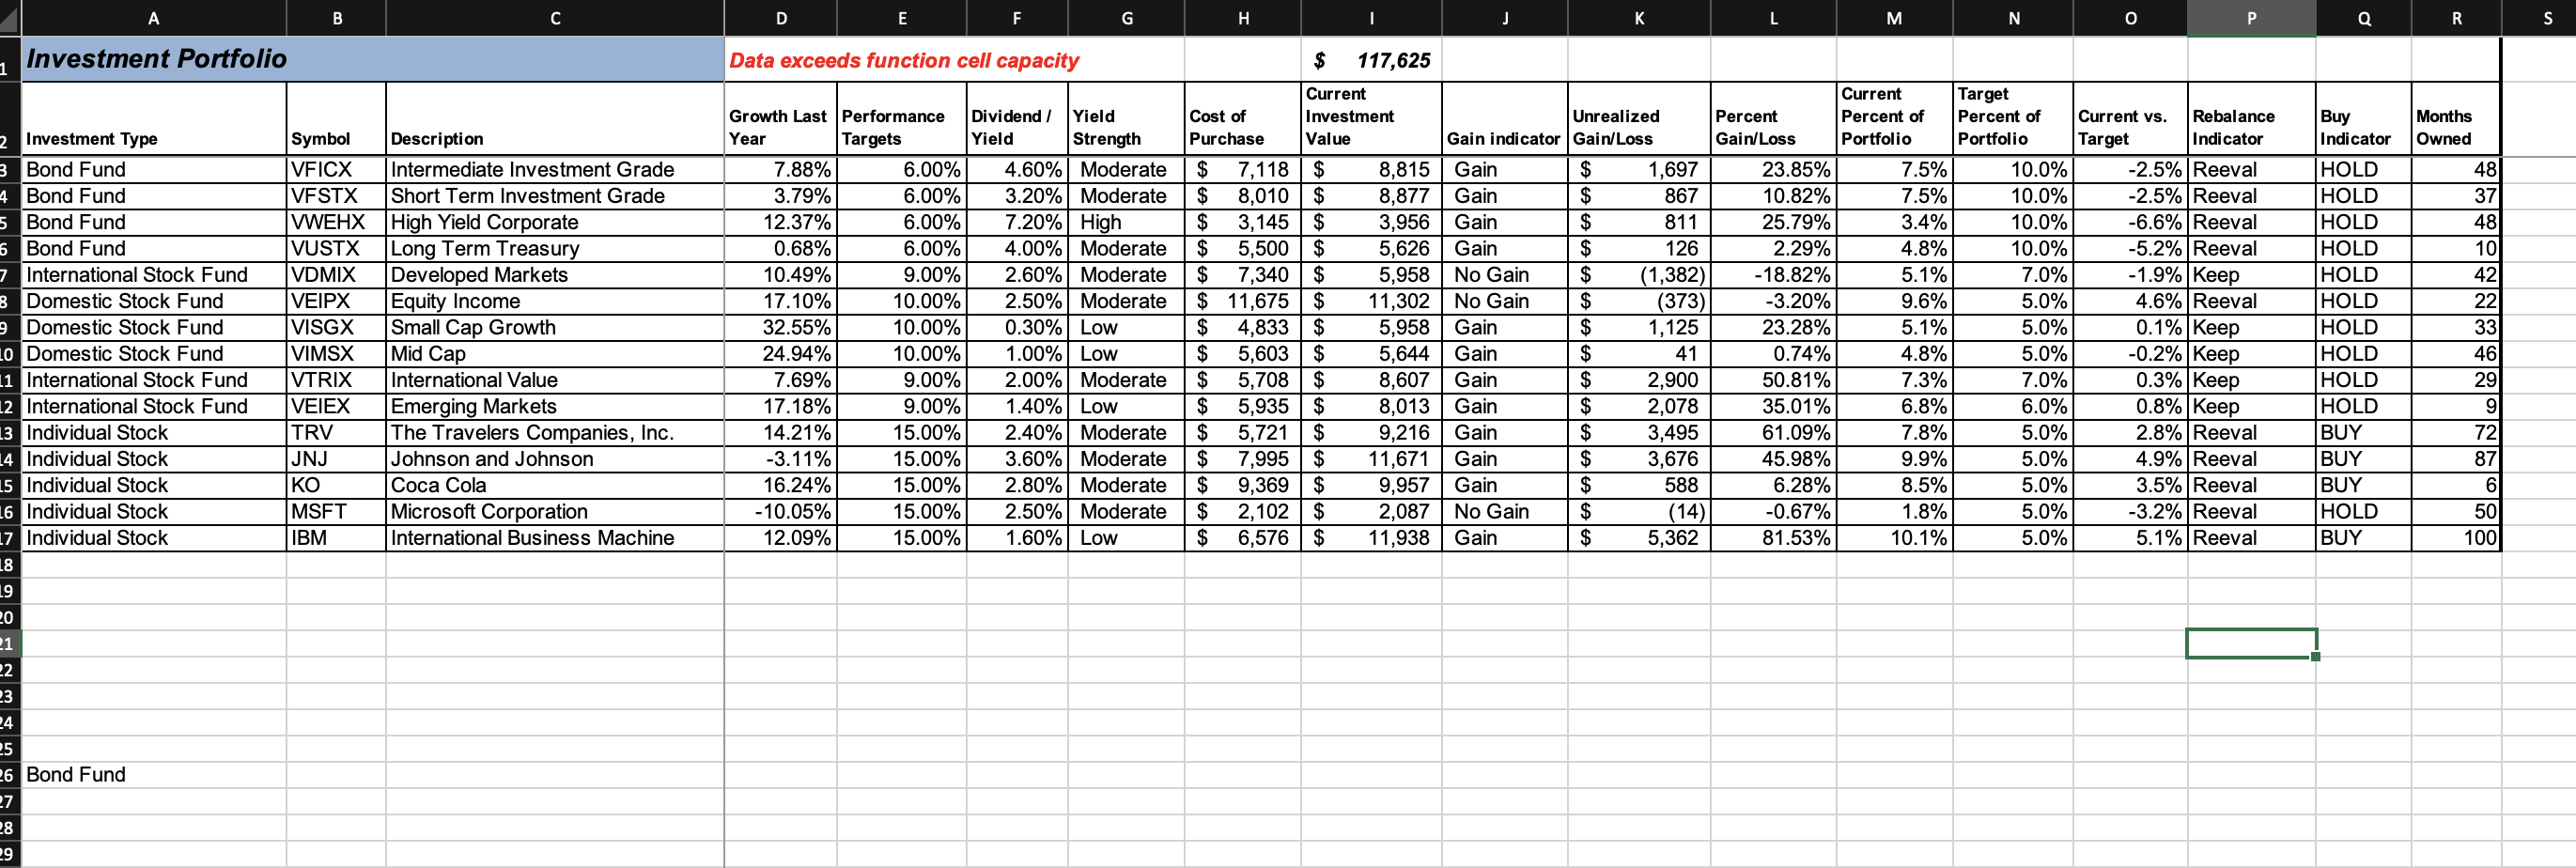
- Enter a SUMIFS function in cell C10 on the Summary worksheet. The purpose of the function is to sum the values in the Unrealized Gain/Loss column on the Investment Detail worksheet based on two conditions. The first is where the Investment Type column on the Investment Detail worksheet matches the investment type in cell A10. The second condition is where the value in the Percent Gain/Loss column on the Investment Detail worksheet is greater than or equal to 15%. Include cell capacity through Row 25 when defining arguments that require a cell range and use absolute references when needed.
- Enter an AVERAGEIFS function in cell D10 on the Summary worksheet. The purpose of the function is to compute the average of the values in the Months Owned column on the Investment Detail worksheet based on two conditions. The first condition is where the Investment Type column on the Investment Detail worksheet matches the investment type in cell A10. The second condition is where the value in the Percent Gain/Loss column on the Investment Detail worksheet is greater than or equal to 15%. Include cell capacity through Row 25 when defining arguments that require a cell range and use absolute references when needed.
- Enter a CONCATENATE function in the merge cell range beginning with cell A7 in the Summary worksheet. The function should combine the phrase Error Warning: with the entry in cell D1 on the Investment Detail worksheet.
A1 X V fx Portfolio Summary A B C D E 1 Portfolio Summary Investment Type Number of Investments Percent of Portfolio 2 Average Yield wN 3 Bond Fund 4. Domestic Stock Fund 5 International Stock Fund 6 Individual Stock 7 8 High Profit Investments Investment Type Number of Investments Total Unrealized Gain 9 Months Owned 10 Bond Fund 11 Domestic Stock Fund 12 International Stock Fund 13 Individual Stock 14 15 16 A B C D E F H J M N O P Q R S Investment Portfolio 1 Data exceeds function cell capacity Months Owned 6|| 2 Investment Type 3 Bond Fund 4 Bond Fund 5 Bond Fund 6 Bond Fund 7 International Stock Fund 8 Domestic Stock Fund 9 Domestic Stock Fund LO Domestic Stock Fund 1 International Stock Fund 12 International Stock Fund 13 Individual Stock 14 Individual Stock 15 Individual Stock 16 Individual Stock 17 Individual Stock 18 19 20 21 22 23 24 25 26 Bond Fund 27 28 19 Symbol VFICX VFSTX WWEHX VUSTX VDMIX VEIPX VISGX VIMSX VTRIX VEIEX TRV JNJ KO MSFT IBM Description Intermediate Investment Grade Short Term Investment Grade High Yield Corporate Long Term Treasury Developed Markets Equity Income Small Cap Growth Mid Cap International Value Emerging Markets The Travelers Companies, Inc. Johnson and Johnson Coca Cola Microsoft Corporation International Business Machine Growth Last Performance Dividend / Yield Year Targets Yield Strength 7.88% 6.00% 4.60% Moderate 3.79% 6.00% 3.20% Moderate 12.37% 6.00% 7.20% High 0.68% 6.00% 4.00% Moderate 10.49% 9.00% 2.60% Moderate 17.10% 10.00% 2.50% Moderate 32.55% 10.00% 0.30% Low 24.94% 10.00% 1.00% Low 7.69% 9.00% 2.00% Moderate 17.18% 9.00% 1.40% Low 14.21% 15.00% 2.40% Moderate -3.11% 15.00% 3.60% Moderate 16.24% 15.00% 2.80% Moderate -10.05% 15.00% 2.50% Moderate 12.09% 15.00% 1.60% Low $ 117,625 Current Current Target Cost of Investment Unrealized Percent Percent of Percent of Current vs. Rebalance Purchase Value Gain indicator Gain/Loss Gain/Loss Portfolio Portfolio Target Indicator $ 7,118 $ 8,815 Gain $ 1,697 23.85% 7.5% 10.0% -2.5% Reeval $ 8,010 $ 8,877 Gain $ 867 10.82% 7.5% 10.0% -2.5% Reeval $ 3,145 $ 3,956 Gain $ 811 25.79% 3.4% 10.0% -6.6% Reeval $ 5,500 $ 5,626 Gain $ 126 2.29% 4.8% 10.0% -5.2% Reeval $ 7,340 $ 5,958 No Gain $ (1,382) -18.82% 5.1% 7.0% -1.9% Keep $ 11,675$ 11,302 No Gain $ (373) -3.20% 9.6% 5.0% 4.6% Reeval $ 4,833 $ 5,958 Gain $ 1,125 23.28% 5.1% 5.0% 0.1% Keep $ 5,603 $ 5,644 Gain $ 41 0.74% 4.8% 5.0% -0.2% Keep $ 5,708$ 8,607 Gain $ 2,900 50.81% 7.3% 7.0% 0.3% Keep $ 5,935 $ 8,013 Gain $ 2,078 35.01% 6.8% 6.0% 0.8% Keep $ 5,721 $ 9,216 Gain $ 3,495 61.09% 7.8% 5.0% 2.8% Reeval 7,995 $ 11,671 Gain $ 3,676 45.98% 9.9% 5.0% 4.9% Reeval $ 9,369 $ 9,957 Gain $ 588 6.28% 8.5% 5.0% 3.5% Reeval $ 2,102 $ 2,087 No Gain $ (14) -0.67% 1.8% 5.0% -3.2% Reeval 6,576 $ 11,938 Gain $ 5,362 81.53% 10.1% 5.0% 5.1% Reeval Buy Indicator HOLD HOLD HOLD HOLD HOLD HOLD HOLD HOLD HOLD HOLD BUY BUY BUY HOLD BUY | 18||||||| 48 37 48 10 42 22 33 46 29 9 72 87 6 50 100
Step by Step Solution
There are 3 Steps involved in it

Get step-by-step solutions from verified subject matter experts