

Question: Show excel formulas used. Enter a COUNTIF function in cell B3 on the Summary worksheet. The function should count the entries in the Investment Type
Show excel formulas used.
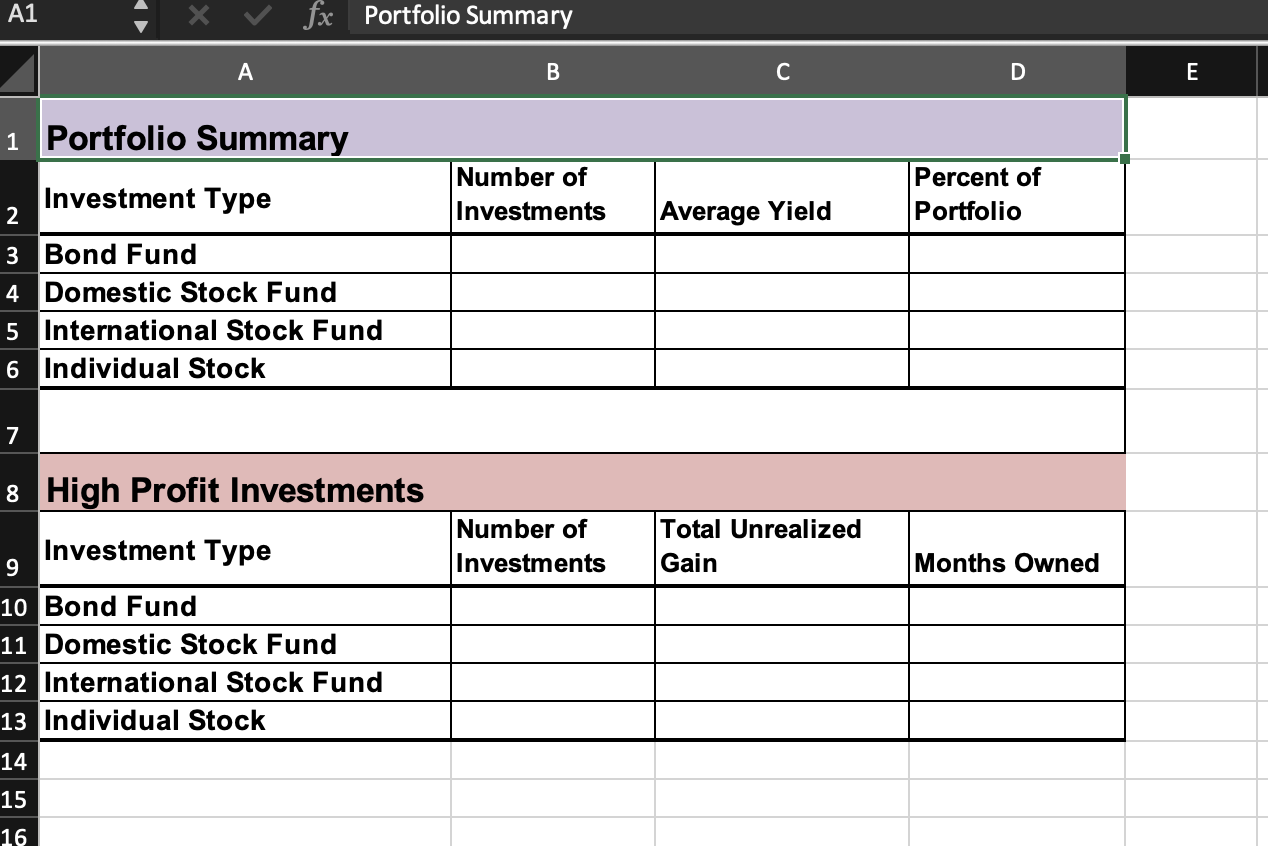
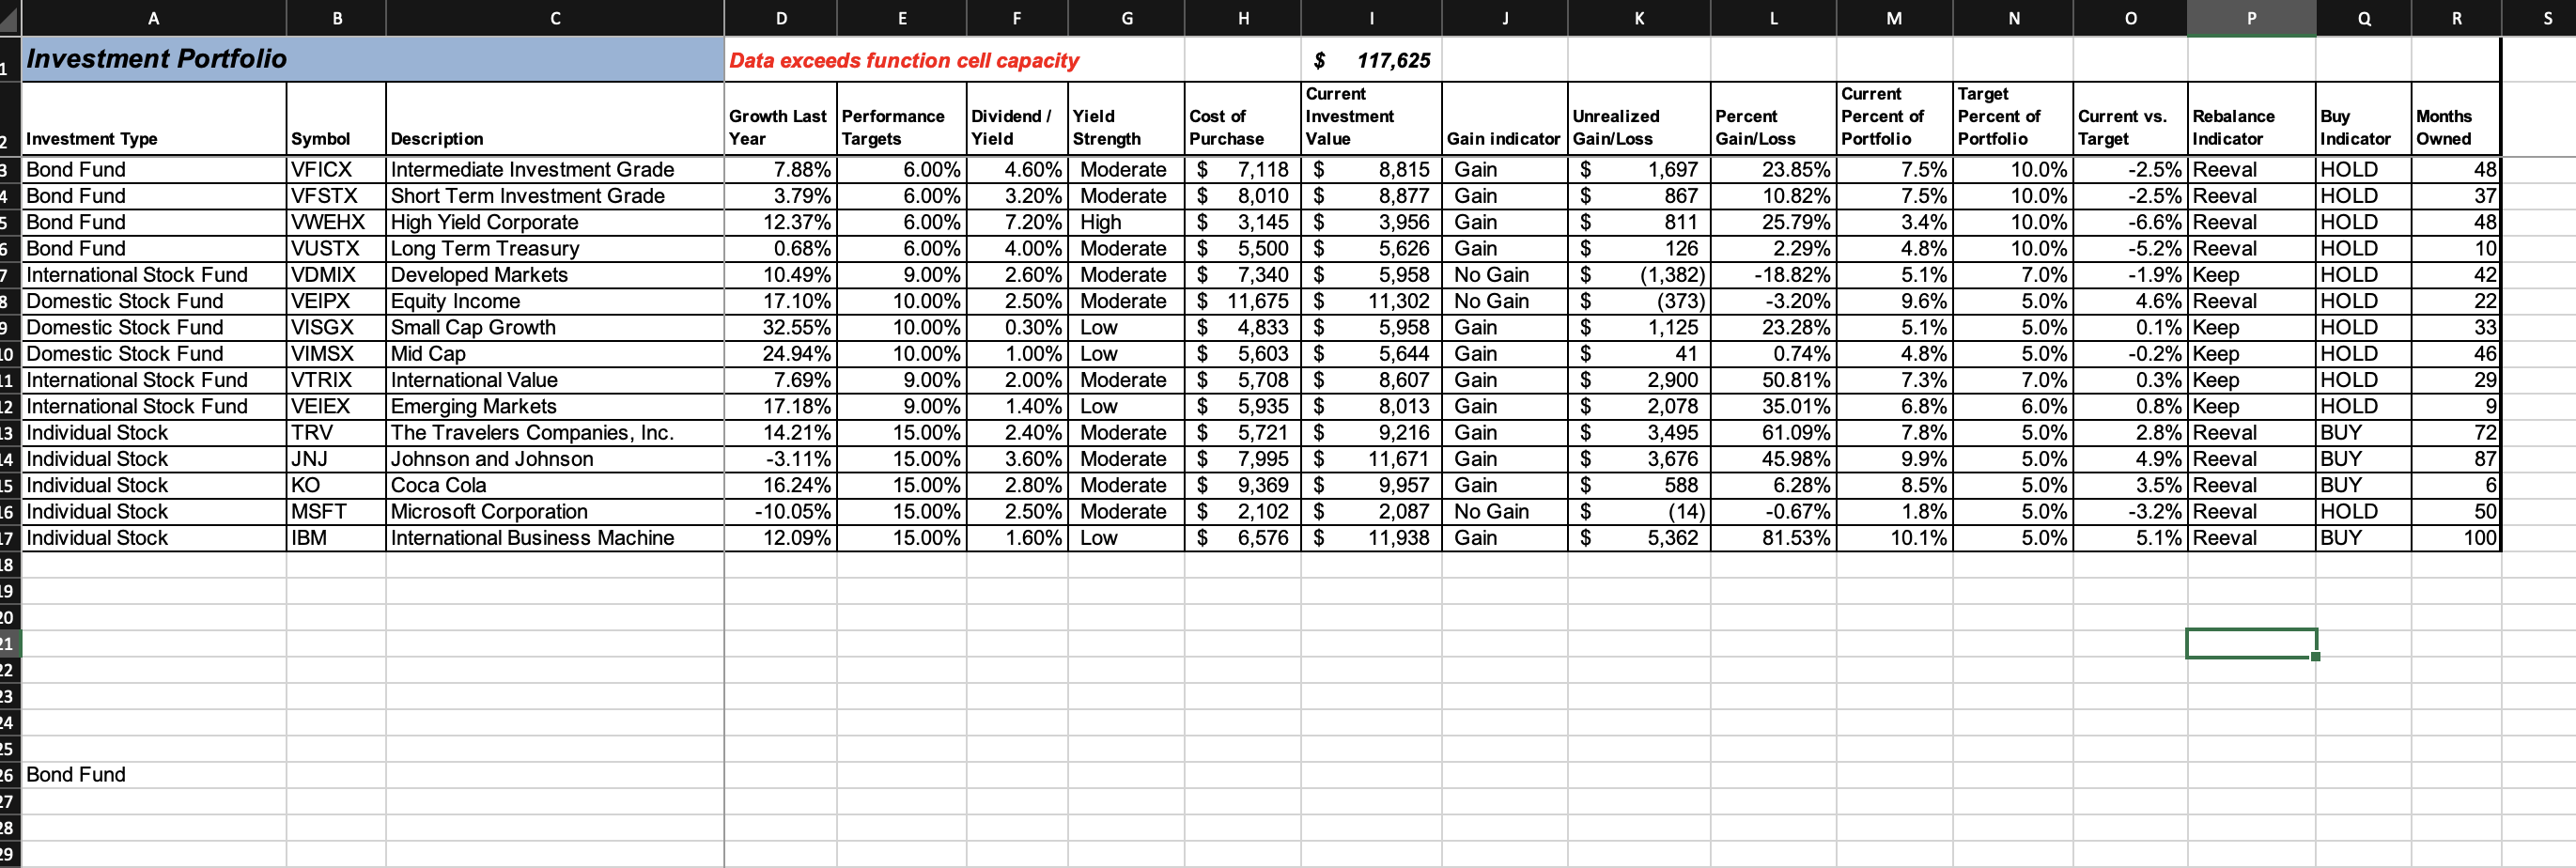
- Enter a COUNTIF function in cell B3 on the Summary worksheet. The function should count the entries in the Investment Type column on the Investment Detail worksheet that match cell A3 on the Summary worksheet. Include cell capacity through Row 25 when defining arguments that require a cell range and use absolute references when needed.
- Enter an AVERAGEIF function in cell C3 on the Summary worksheet. The function should compute the average of the entries in the Dividend/Yield column on the Investment Detail worksheet where there is a match in the Investment Type column on the Investment Detail worksheet with cell A3 on the Summary worksheet. Include cell capacity through Row 25 when defining arguments that require a cell range and use absolute references when needed.
- Enter a SUMIF function in cell D3 on the Summary worksheet. The function should compute the sum of the entries in the Current Percent of Portfolio column on the Investment Detail worksheet where there is a match in the Investment Type column on the Investment Detail worksheet with cell A3 on the Summary worksheet. Include cell capacity through Row 25 when defining arguments that require a cell range and use absolute references when needed.
- Enter a COUNTIFS function in cell B10 on the Summary worksheet. The function should count the number of investments on the Investment Detail worksheet that match the investment type in cell A10 on the Summary worksheet and achieved a gain that is greater than or equal to 15%. Use the Percent Gain/Loss column on the Investment Detail worksheet to evaluate the gains for each investment. Include cell capacity through Row 25 when defining arguments that require a cell range and use absolute references when needed.
Step by Step Solution
There are 3 Steps involved in it
1 Expert Approved Answer
Step: 1 Unlock

Question Has Been Solved by an Expert!
Get step-by-step solutions from verified subject matter experts
Step: 2 Unlock
Step: 3 Unlock